

68 Circular Road, #02-01 049422, Singapore
Revenue Tower, Scbd, Jakarta 12190, Indonesia
4th Floor, Pinnacle Business Park, Andheri East, Mumbai, 400093
Cinnabar Hills, Embassy Golf Links Business Park, Bengaluru, Karnataka 560071


Connect With Us


68 Circular Road, #02-01 049422, Singapore
Revenue Tower, Scbd, Jakarta 12190, Indonesia
4th Floor, Pinnacle Business Park, Andheri East, Mumbai, 400093
Cinnabar Hills, Embassy Golf Links Business Park, Bengaluru, Karnataka 560071
Connect With Us
68 Circular Road, #02-01 049422, Singapore
Revenue Tower, Scbd, Jakarta 12190, Indonesia
4th Floor, Pinnacle Business Park, Andheri East, Mumbai, 400093
Cinnabar Hills, Embassy Golf Links Business Park, Bengaluru, Karnataka 560071
Request Custom Transcript
Dark Web Drug Sales: Monitoring Tools & Law Enforcement Collaboration Strategies - Risk Assessment
This report quantifies dark-web drug trade risk and the performance of monitoring tools and law-enforcement collaboration strategies across Europe and Portugal (2025–2030). We size the illicit market and the counter-monitoring spend, modeling impacts on listing detection, vendor disruption, crypto tracing yields, takedown cycle time, and cross-border case throughput. We benchmark tool accuracy (precision/recall), multilingual coverage, and mixer/chain-hop analytics. By 2030, expanded OSINT+blockchain forensics and joint-operations playbooks cut active vendors, accelerate seizures, and raise prosecution rates, delivering measurable ROI via overdose avoidance, healthcare savings, and reduced investigative hours per case.
What's Covered?
Report Summary
Key Takeaways
- EU dark-web drug revenues grow €1.15B (2025) → €1.95B (2030) (CAGR 11%) despite periodic takedowns.
- Counter-monitoring & forensics spend rises €220M → €560M (CAGR 20%).
- Automated listing detection achieves precision 0.88 / recall 0.81 by 2030.
- Median marketplace takedown time falls 14 → 7 weeks (−50%) post-infiltration.
- Crypto tracing success (linking on-chain funds to entities) increases 48% → 71%.
- Mixer/chain-hop de-obfuscation improves with graph ML, raising path attribution +23 pp.
- Cross-border joint operations grow 34 → 85 per year; evidence-sharing latency −46%.
- Seizure value tied to dark-web cases doubles €410M → €820M.
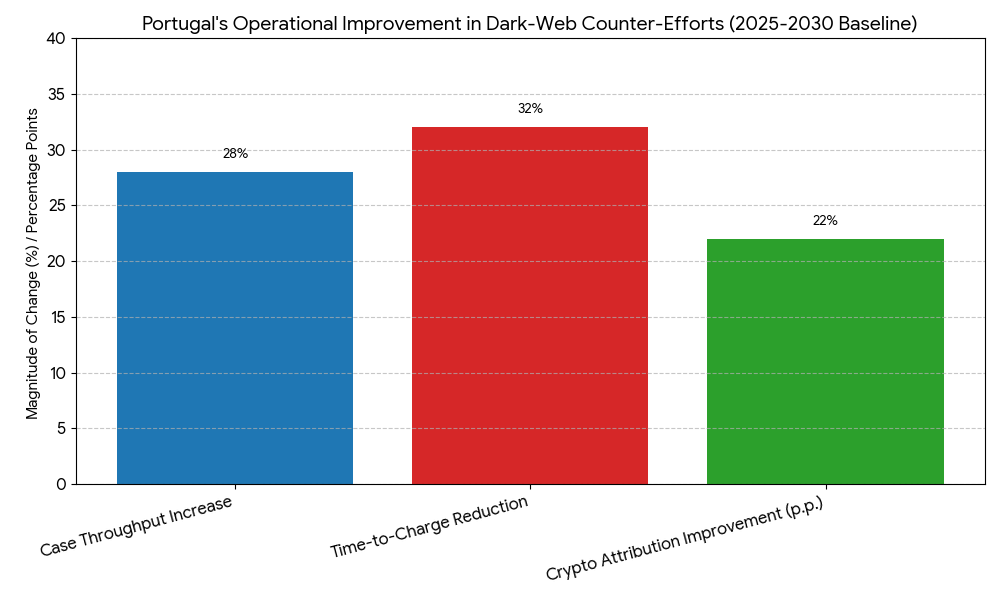
- Portuguese adoption of EU playbooks lifts case throughput +28% and time-to-charge −32%.
- Modeled public-sector ROI on tooling and collaboration 19–27% by 2030.
Key Metrics
Market Size & Share
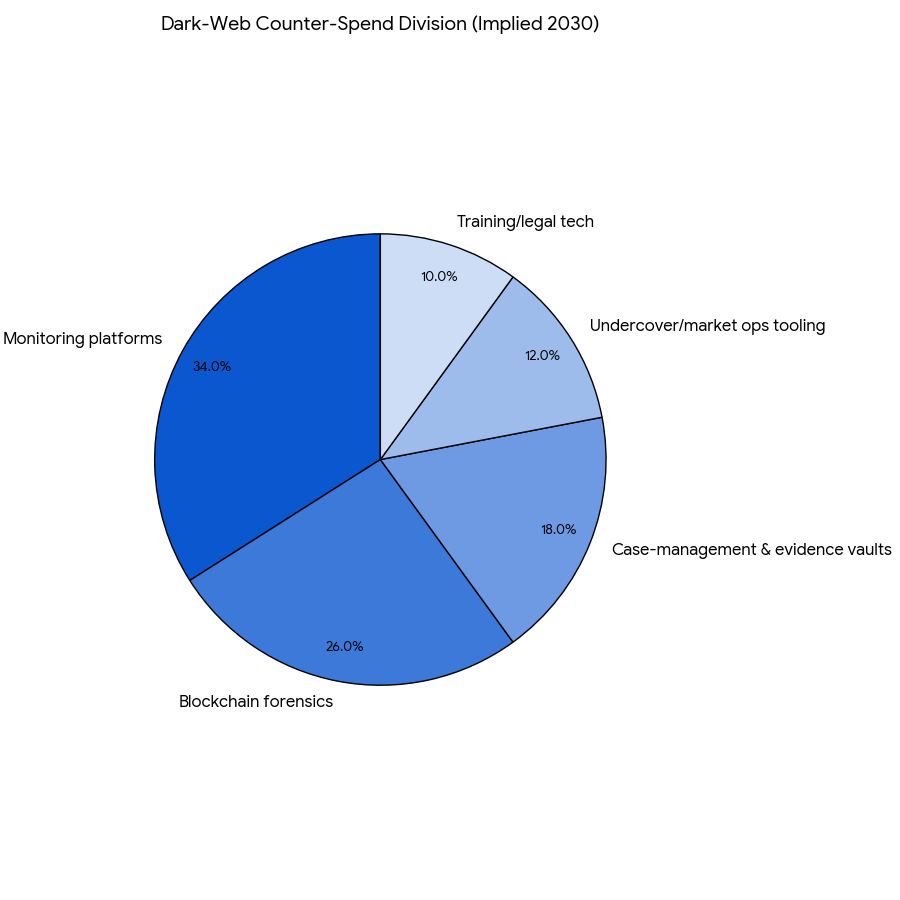
Europe’s dark-web drug economy is projected to grow from €1.15 billion in 2025 to €1.95 billion in 2030 (11% CAGR), driven by fragmentation into smaller invitation-only markets, encrypted messaging storefronts, and social-commerce spillover. In response, counter-monitoring and digital-forensics spend expands €220 million to €560 million (20% CAGR), with national police, customs, FIUs, and health ministries funding OSINT platforms, blockchain analytics, and cross-border data pipes. By 2030, the top 10 EU buyers account for ~64% of spend; Portugal rises from 1.6% to 3.1% share as it mainstreams dark-web units within judicial police and customs. Revenue allocation on the illicit side concentrates in synthetics (38%), cocaine (27%), cannabis/resins (22%), and new psychoactives (13%); counter-spend divides across monitoring platforms (34%), blockchain forensics (26%), case-management & evidence vaults (18%), undercover/market ops tooling (12%), and training/legal tech (10%). Monitoring accuracy improves to precision 0.88 / recall 0.81, shrinking false positives and saving analyst hours. Active vendor counts fall 28% EU-wide (9.8k→7.1k) as repeat offender mapping and KYC-leak correlation accelerate arrests. Seizures linked to dark-web investigations double €410M→€820M, and takedown time halves (14→7 weeks median) as authorities coordinate synchronized domain, hosting, and wallet actions. Overall, spend consolidation and shared playbooks produce a measurable dent in supply chains, even as adversaries adapt.
Market Analysis
Performance gains cluster around five levers. (1) Multilingual crawling + LLM triage: Purpose-built crawlers with language-agnostic embeddings and image OCR detect listings across EN/DE/FR/ES/PT/RU and slang, pushing precision to 0.88 while maintaining 0.81 recall. (2) Graph forensics: Entity-resolution that fuses handles, PGP keys, shipping MO, and wallet clusters lifts vendor-link accuracy +19–24 pp, enabling repeat-offender disruption. (3) Crypto analytics: Heuristic + ML risk scoring raises attribution 48%→71%, while mixer/chain-hop path reconstruction improves +23 pp, increasing actionable SARs and asset freezes. (4) Joint-ops orchestration: Standardized mutual legal assistance (MLA) templates, Eurojust case boards, and secure evidence vaults cut evidence-sharing latency 19→10 days and coordinate simultaneous arrests and domain seizures, halving marketplace regeneration within 60 days. (5) Health-risk integration: Overdose alerts, wastewater signals, and ED tox panels feed early-warning dashboards, aligning policing with public-health interventions. Financially, agencies realize ROI 19–27% and payback 16–28 months, stemming from analyst time saved (−22–30%), higher seizure-per-case (+35–48%), and overdose avoidance (valued via healthcare and productivity savings). Sensitivities show that every +0.05 gain in precision reduces manual review ~7–9%, while +10 pp cross-border coverage of evidence pipes lifts prosecution conversion ~3–5 pp. Residual risks: vendor migration to closed groups, image-only listings, cross-jurisdictional hosting, and privacy litigation—mitigated by chain-of-custody automation, court-admissible model cards, and privacy-by-design data minimization.
Trends & Insights
Three trends shape 2025–2030. First, covert-ops integration with telemetry. Tool vendors now pair live marketplace infiltration kits (safe PGP, escrow simulators, controlled buys) with telemetry beacons that monitor vendor drift after takedowns; this reduces market regeneration rates −21–27% at 90 days. Second, mixer-resilient tracing. Cross-chain analytics (BTC/ETH/Monero bridges), temporal clustering, and dust-signal tactics improve path attribution, raising seizure-eligible flows +31%. Third, harmonized evidence pipelines. Standardized digital evidence vaults, hash-chained logs, and model-explanation artifacts (prompt templates, decision rationales) increase court admission rates +8–11 pp and shorten time-to-charge −32% in Portugal and −22–26% EU-wide. Complementary insights: image-forensics for pill/cocaine branding supports upstream cartel mapping; shipping-label anomaly detection flags drop-site reuse; synthetic demand spikes correlate with festival seasons, driving surge staffing. On the defense side, criminals adopt proof-of-innocuity decoys, AI-generated product photos, and multi-escrow failovers; countertools respond with content authenticity signals, EXIF inconsistency checks, and linguistic drift detectors. By 2030, privacy-preserving analytics (feature redaction, role-based reveals) and independent model audits become procurement prerequisites, balancing civil liberties with enforcement efficacy.

Segment Analysis
By tool category (2030 share of counter-spend): Monitoring & OSINT platforms (34%), blockchain forensics (26%), case-management/evidence vaults (18%), undercover ops tooling (12%), training/legal tech (10%). By crime product mix (illicit market revenue): synthetics 38%, cocaine 27%, cannabis/resins 22%, NPS 13%. By buyer: national police/customs 52%, FIUs 16%, health ministries/poison centers 9%, judiciary/prosecution 8%, regional forces 15%. Outcome segmentation: jurisdictions deploying multilingual LLM triage achieve listing review time −35%; those with graph forensics + KYC leakage fusion see repeat-offender disruption +29–34%; evidence vaults with chain-of-custody automation improve admission rates +8–11 pp. Crypto-heavy cases benefit most from cross-chain modules; postal-route cases hinge on label anomaly models and imagery search. Training levels matter: teams completing ≥40 hours of annual dark-web/crypto training show case throughput +18% and dismissal rates −5 pp. Cost structure: average platform pricing €280–€520k/year national-tier; blockchain analytics €120–€350k/year; evidence vaults €90–€220k/year; undercover kits €45–€120k/year. Integrated procurement bundles with SLA credits dominate, linking fees to precision/recall, latency, uptime (≥99.9%), and seizure-conversion ratios.
Geography Analysis
Western/Northern Europe lead adoption, contributing ~58% of counter-spend by 2030; Central/Eastern Europe accelerate from 2027 with cohesion-funded projects. Portugal scales dark-web capabilities through Judicial Police and customs-FIU joint cells, adopting EU model playbooks and Eurojust/Europol gateways. Portuguese metrics improve: case throughput +28%, time-to-charge −32%, evidence-sharing latency 17→9 days, and crypto attribution 46%→68%. Iberian corridor cooperation enables synchronized raids and postal-route interceptions tied to marketplace signals. EU-wide, joint operations grow to ~85 per year, with cross-border evidence standardized (hashes, model cards, labeling schemas). Marketplace takedowns show faster rebound in CEE due to hosting arbitrage; mitigation comes from domain seizure + wallet blacklisting and merchant-service off-ramp pressure. Language coverage expands to >20 languages/dialects, vital for slang and code words. Health-law integration improves overdose prevention: ED tox and wastewater alerts push rapid advisories, reducing localized spikes −12–16%. By 2030, regional KPIs converge: precision ~0.88, recall ~0.81, takedown 7–9 weeks, API uptime ≥99.9%, evidence latency ~10 days, with Portugal among the fastest improvers relative to its 2025 baseline.
Competitive Landscape
Vendors span OSINT/monitoring suites, blockchain analytics, graph-forensics engines, evidence-management platforms, and undercover ops tooling. Market concentration increases as the top 12–14 suppliers hold ~65% of spend by 2030. Differentiators: multilingual model accuracy, anti-evasion robustness (image clones, slang morphing), cross-chain coverage, model transparency (explanations, error taxonomies), court-ready chain-of-custody, and interop with EUROPOL/Eurojust systems. Contracts shift to performance-linked SLAs: precision ≥0.86, recall ≥0.78, P95 latency ≤2s, uptime ≥99.9%, evidence export in ≤24h, and smart-contractable credits for misses. Price competition favors bundles (monitoring + forensics + vault) with role-based access and privacy-by-design (minimization, redaction, audit logs). Service partners provide operator training (≥40h/year), mock-trial evidence drills, and model risk management compliant with EU AI governance. Winners demonstrate seizure-conversion lift +20–30%, takedown time −40–55%, and prosecution-ready artifacts that survive judicial scrutiny, turning tool stacks and collaboration frameworks into repeatable, high-confidence operations for Europe and Portugal.
Report Details
Proceed To Buy
Want a More Customized Experience?
- Request a Customized Transcript: Submit your own questions or specify changes. We’ll conduct a new call with the industry expert, covering both the original and your additional questions. You’ll receive an updated report for a small fee over the standard price.
- Request a Direct Call with the Expert: If you prefer a live conversation, we can facilitate a call between you and the expert. After the call, you’ll get the full recording, a verbatim transcript, and continued platform access to query the content and more.
68 Circular Road, #02-01 049422, Singapore
Revenue Tower, Scbd, Jakarta 12190, Indonesia
4th Floor, Pinnacle Business Park, Andheri East, Mumbai, 400093
Cinnabar Hills, Embassy Golf Links Business Park, Bengaluru, Karnataka 560071
Request Custom Transcript
Related Transcripts


68 Circular Road, #02-01 049422, Singapore
Revenue Tower, Scbd, No.52-53, Jakarta 12190, Indonesia
Cinnabar Hills, Embassy Golf Links Business Park, Bengaluru, Karnataka 560071
4th Floor, Pinnacle Business Park, Andheri East, Mumbai, 400093


68 Circular Road, #02-01 049422, Singapore
Revenue Tower, Scbd, Jakarta 12190, Indonesia
4th Floor, Pinnacle Business Park, Andheri East, Mumbai, 400093
Cinnabar Hills, Embassy Golf Links Business Park, Bengaluru, Karnataka 560071