

68 Circular Road, #02-01 049422, Singapore
Revenue Tower, Scbd, Jakarta 12190, Indonesia
4th Floor, Pinnacle Business Park, Andheri East, Mumbai, 400093
Cinnabar Hills, Embassy Golf Links Business Park, Bengaluru, Karnataka 560071


Connect With Us


68 Circular Road, #02-01 049422, Singapore
Revenue Tower, Scbd, Jakarta 12190, Indonesia
4th Floor, Pinnacle Business Park, Andheri East, Mumbai, 400093
Cinnabar Hills, Embassy Golf Links Business Park, Bengaluru, Karnataka 560071
Connect With Us
68 Circular Road, #02-01 049422, Singapore
Revenue Tower, Scbd, Jakarta 12190, Indonesia
4th Floor, Pinnacle Business Park, Andheri East, Mumbai, 400093
Cinnabar Hills, Embassy Golf Links Business Park, Bengaluru, Karnataka 560071
Request Custom Transcript
Healthcare Equipment Leasing: Market Growth, Cost Efficiency & Adoption Forecast (2025–2030, Global & Regional Focus)
The global healthcare equipment leasing market is set to grow rapidly as hospitals, clinics, and diagnostic centers pursue asset-light models to combat capital strain. Between 2025 and 2030, market value is expected to expand from $54B to $98B (11.1% CAGR). Growth is driven by rising medical device costs, flexible financing needs, and government-backed leasing incentives across the U.S., Europe, and Asia-Pacific.
What's Covered?
Report Summary

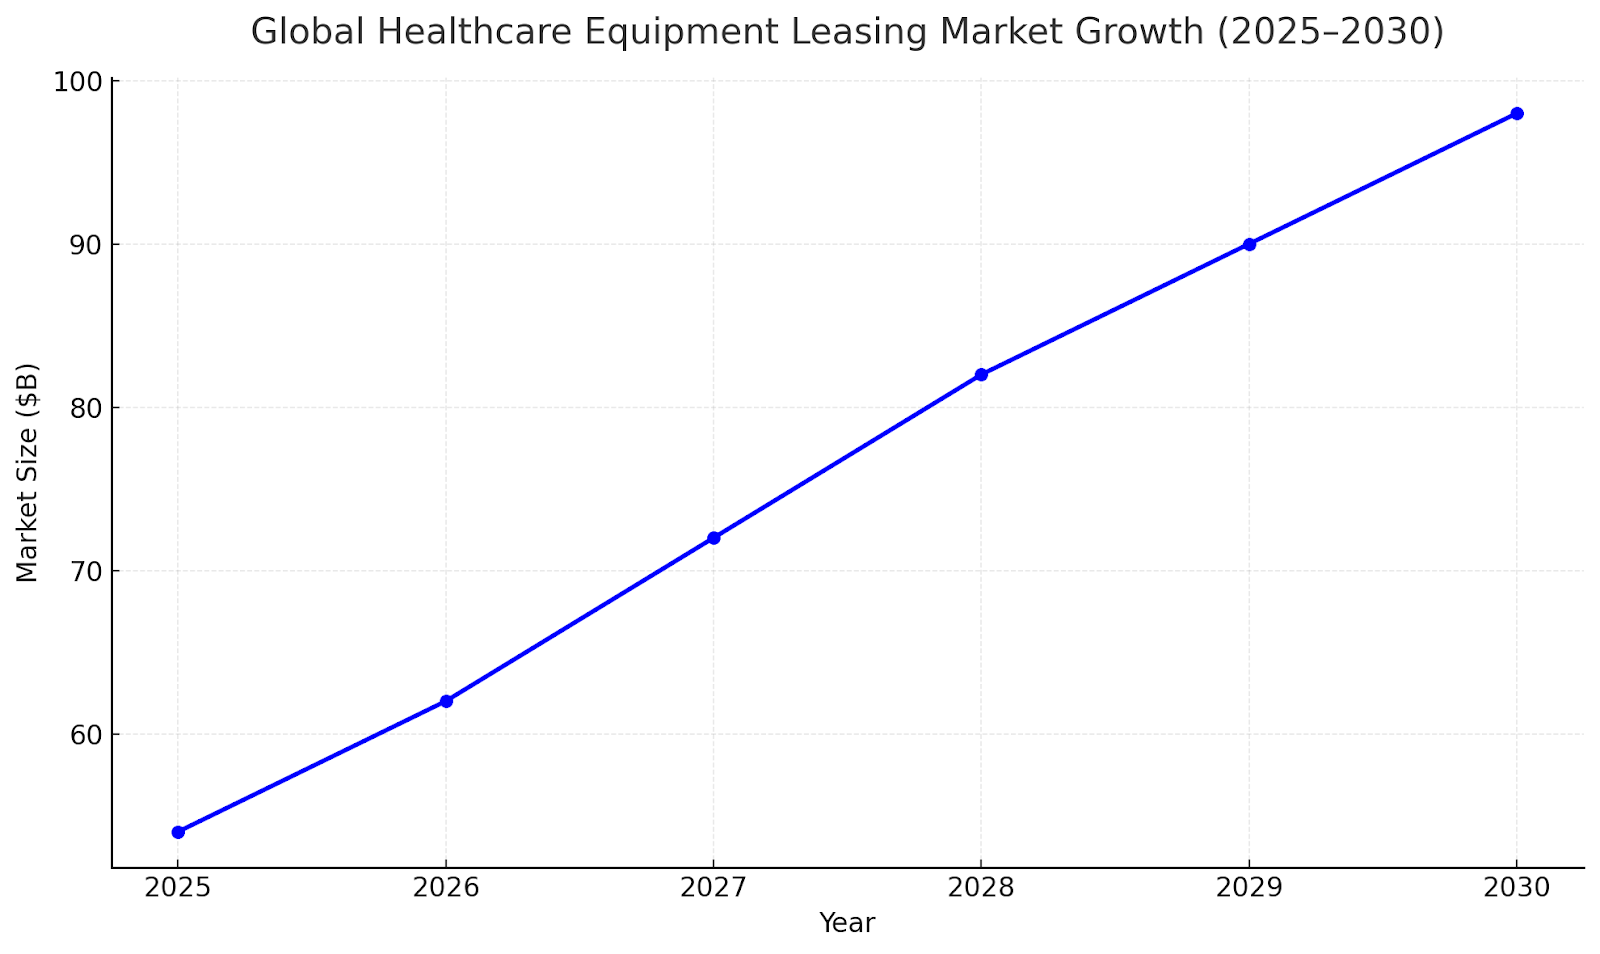
Global Market Growth Outlook (2025–2030)
The healthcare equipment leasing market is projected to expand from $54B in 2024 to $98B by 2030, driven by increasing adoption of flexible financing solutions. Hospitals and clinics are shifting toward operational leases to manage liquidity and access cutting-edge equipment without heavy upfront investment. North America accounts for 41% of global value, followed by Europe (32%) and APAC (21%). APAC’s double-digit growth stems from rising private-sector healthcare investments and digital diagnostic expansion.
Segment Analysis: Equipment Type Trends
Diagnostic imaging equipment—MRI, CT scanners, and X-ray systems—represents 42% of total leasing contracts, with steady demand from radiology networks and multi-specialty hospitals. Surgical and therapeutic equipment account for 28%, followed by laboratory and patient monitoring systems (20%). Portable and AI-enabled medical devices show the highest lease renewal frequency (~2.8 years), indicating faster tech obsolescence cycles.
Lease Model Evolution (Operational vs. Financial)
Operational leases dominate due to their off-balance-sheet advantages. By 2030, 63% of all contracts will be operational in nature, allowing hospitals to upgrade equipment every 3–5 years. Financial leases remain relevant for high-value assets like MRIs and surgical robots. Hybrid leasing packages—bundling maintenance, software updates, and uptime guarantees—are emerging as preferred models for medium-sized hospitals.
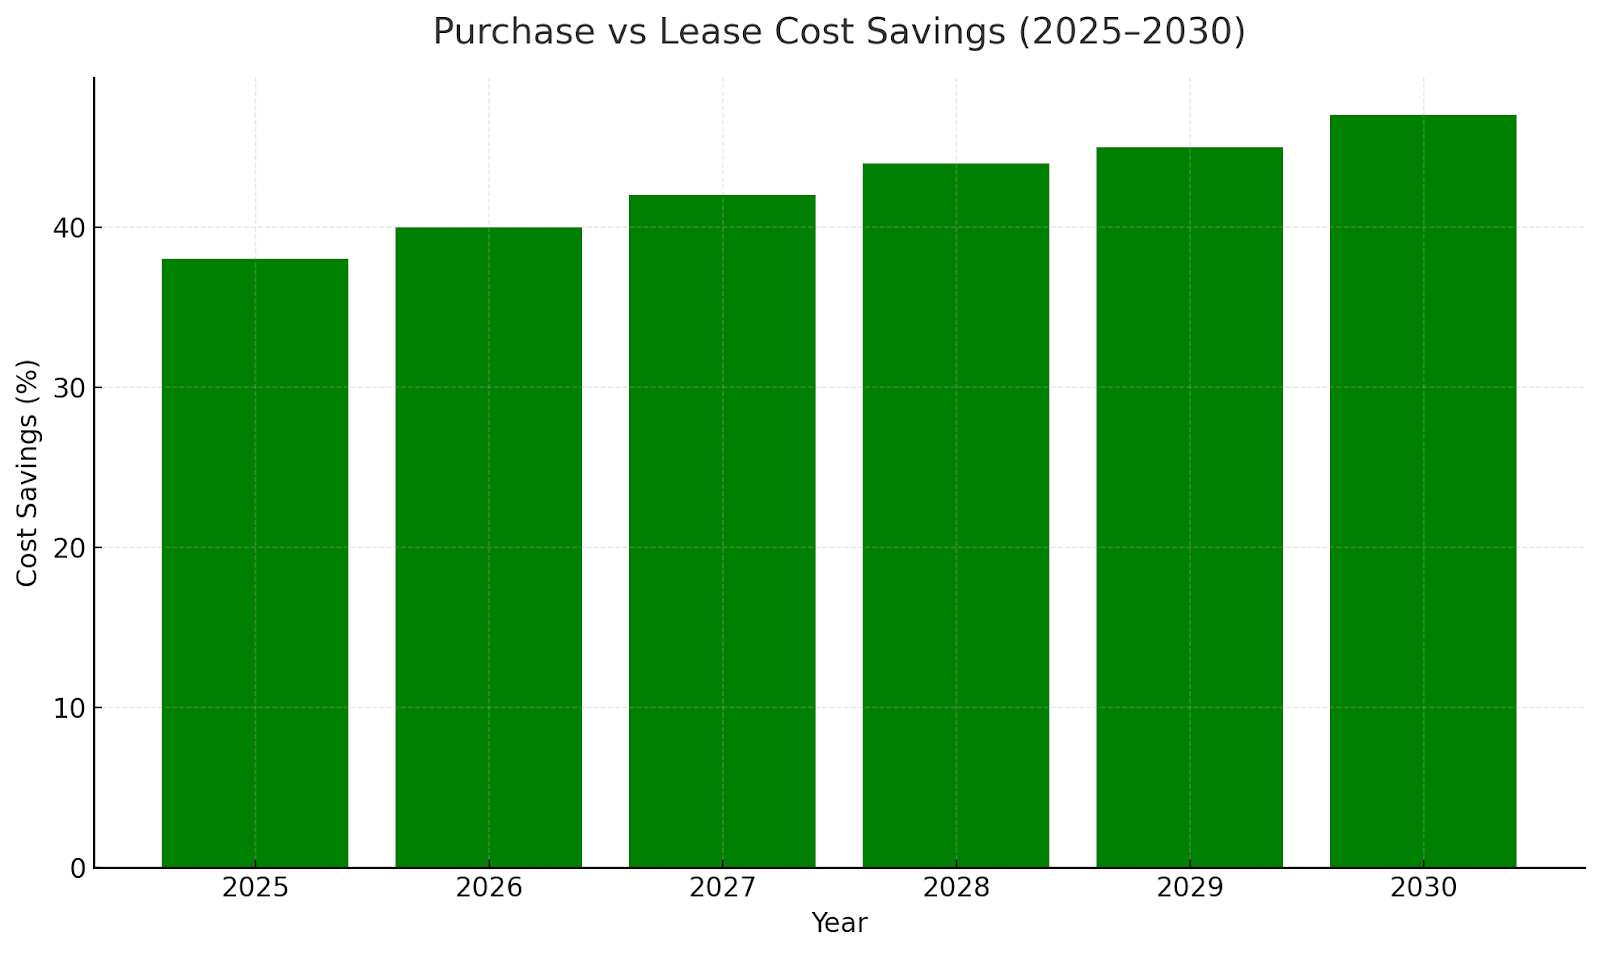
Cost Efficiency & ROI from Leasing
Hospitals leasing medical devices report 45–55% lower upfront CAPEX compared to purchasing. Average payback periods shrink from 7 years to 3.8 years under operational leases. Cost savings are amplified by bundled service contracts and tax benefits. Leasing also mitigates depreciation risk and enables periodic technology refresh cycles.
Key Industry Players & Ecosystem
Major players include Siemens Financial Services, GE Capital, Philips Medical Finance, Canon Medical, and De Lage Landen (DLL). Financial institutions partner with OEMs to structure flexible terms with integrated servicing. Startups offering fintech-based equipment leasing platforms are gaining ground, particularly in emerging markets. These platforms provide credit scoring, contract tracking, and equipment utilization analytics to improve transparency and ROI measurement.
Regional Dynamics & Growth Drivers
North America dominates the market, valued at $22B in 2025, but Asia-Pacific will be the fastest-growing region (13.2% CAGR). India, China, and Southeast Asia are witnessing rapid leasing adoption due to private hospital proliferation and supportive government schemes. In Europe, EU healthcare modernization initiatives and circular economy mandates drive equipment leasing for sustainability compliance.
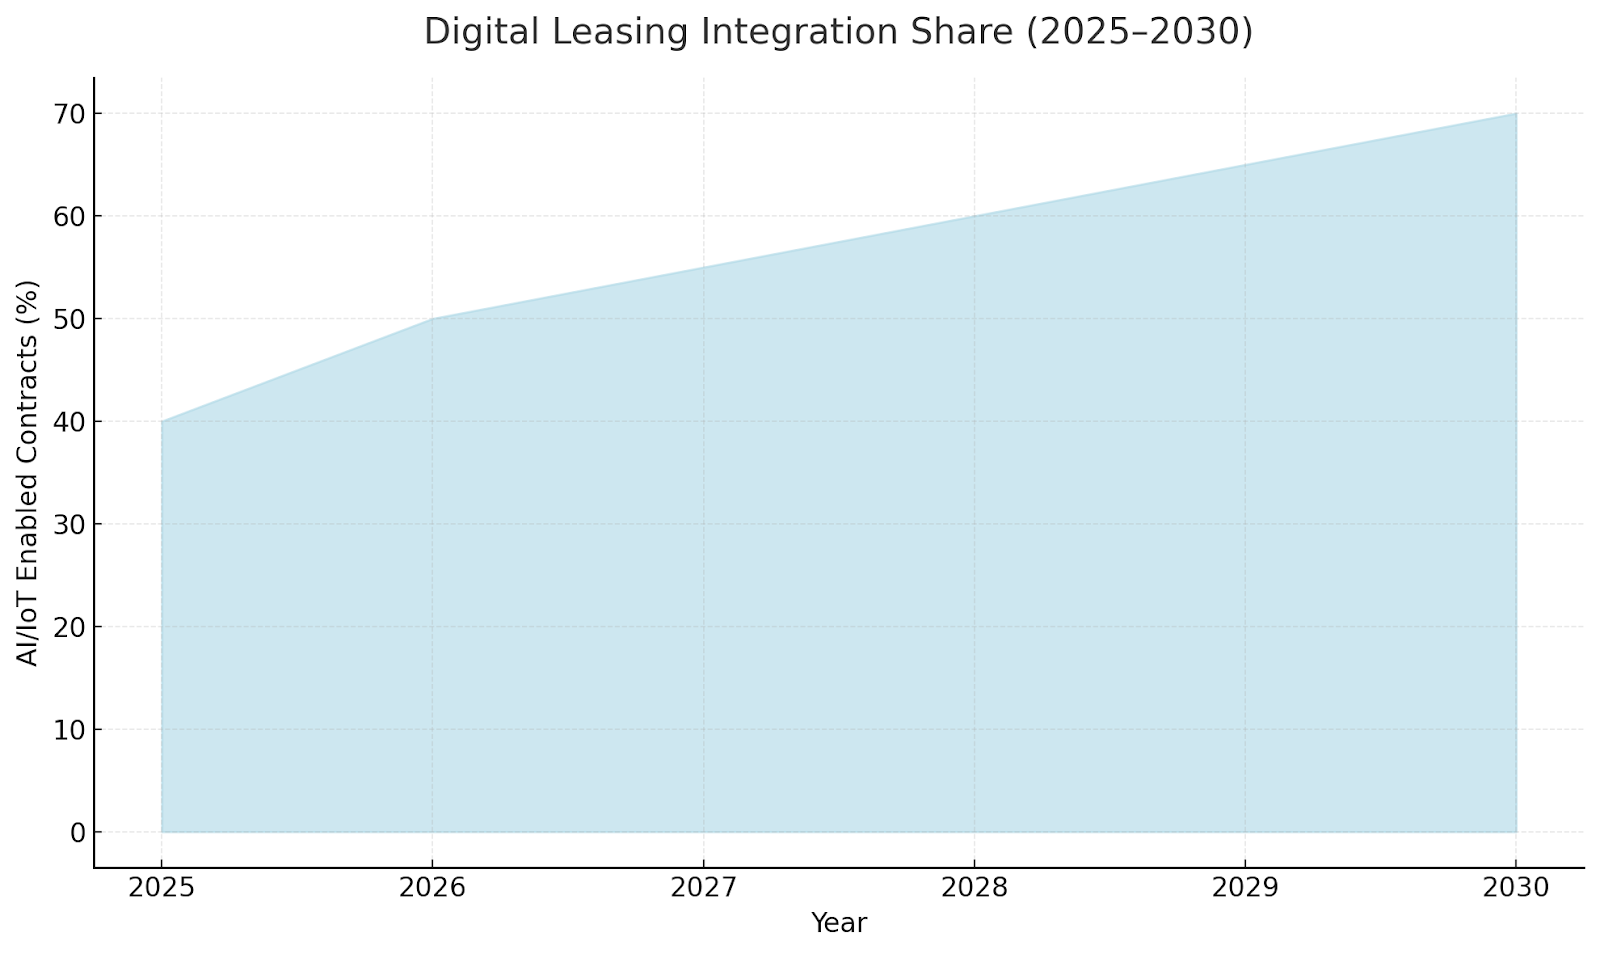
Technology Integration in Leasing Models
IoT-enabled medical devices allow remote asset tracking, predictive maintenance, and usage-based payment models. Smart contracts on blockchain are improving billing transparency, while digital twins simulate utilization for contract optimization. By 2030, 70% of new leasing contracts are expected to include AI/IoT monitoring.
Regulatory & Tax Landscape
Favorable tax treatment for operational leases—especially under IFRS 16 and ASC 842—has accelerated adoption globally. In the U.S., healthcare providers leverage leasing to maintain liquidity ratios under federal value-based care reforms. Europe’s public-private hospital networks benefit from EIB-backed leasing programs for energy-efficient medical infrastructure. Asia-Pacific nations are introducing local credit guarantees to expand access for mid-tier providers.
Barriers & Risks to Adoption
Key challenges include inconsistent tax regimes, lack of awareness among small healthcare providers, and credit approval delays. High interest rates in emerging markets also raise financing costs. Data integration between OEMs, leasing providers, and hospitals remains limited, affecting maintenance accountability. Strengthening credit risk assessment frameworks and standardizing digital contract templates could mitigate adoption hurdles.
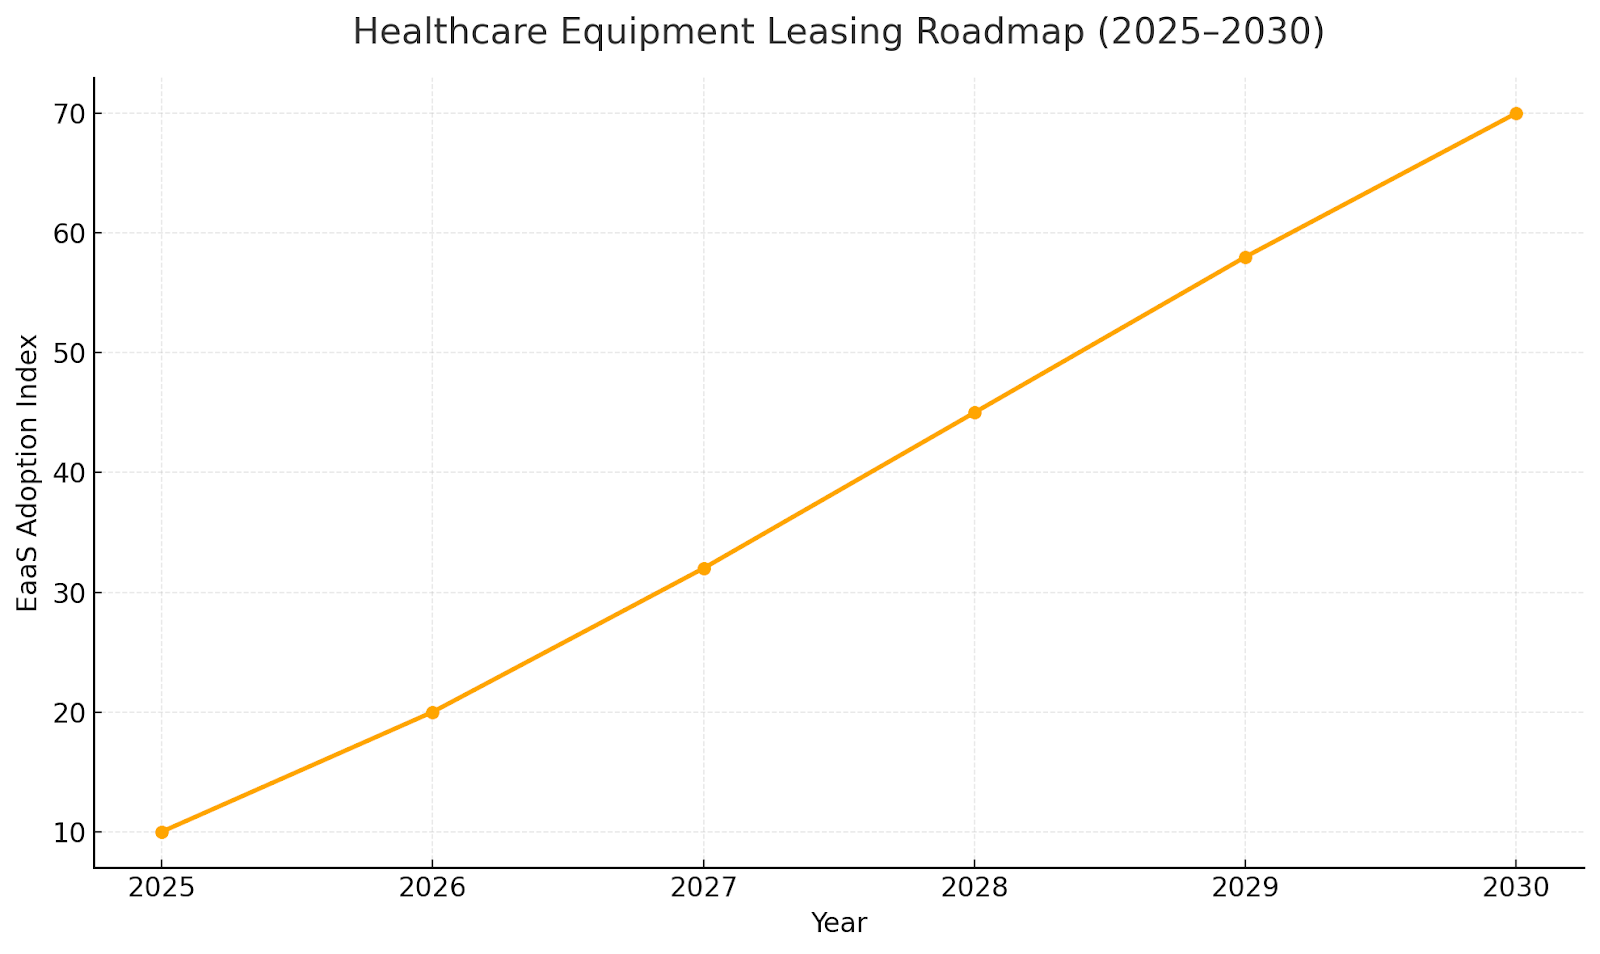
Future Outlook & Market Roadmap (2025–2030)
By 2030, the leasing ecosystem will shift toward fully digital, pay-per-use, and outcome-based contracts. Hospitals will prioritize equipment-as-a-service (EaaS) models combining leasing, maintenance, and performance guarantees. Predictive analytics will guide renewal cycles, while circular economy initiatives promote reuse and refurbishment. The next decade will see leasing transform from a financing tool into a core operational model across global healthcare systems.
Key Takeaways
- Global healthcare equipment leasing to grow from $54B → $98B by 2030 (11.1% CAGR).
- Diagnostic imaging (MRI, CT, ultrasound) remains the largest segment (~42% share).
- Operational lease models dominate 63% of market contracts by 2030.
- Hospitals shifting to asset-light CAPEX reduce upfront costs by 45–55%.
- Asia-Pacific shows the fastest growth (13.2% CAGR) driven by private hospital expansion.
- Technology upgrades and obsolescence cycles fuel recurring lease renewals every 3–5 years.
Report Details
Proceed To Buy
Want a More Customized Experience?
- Request a Customized Transcript: Submit your own questions or specify changes. We’ll conduct a new call with the industry expert, covering both the original and your additional questions. You’ll receive an updated report for a small fee over the standard price.
- Request a Direct Call with the Expert: If you prefer a live conversation, we can facilitate a call between you and the expert. After the call, you’ll get the full recording, a verbatim transcript, and continued platform access to query the content and more.
68 Circular Road, #02-01 049422, Singapore
Revenue Tower, Scbd, Jakarta 12190, Indonesia
4th Floor, Pinnacle Business Park, Andheri East, Mumbai, 400093
Cinnabar Hills, Embassy Golf Links Business Park, Bengaluru, Karnataka 560071
Request Custom Transcript
Related Transcripts

Clinical Nutrition Market Size & Share Analysis - Growth Trends & Forecasts (2025 - 2030)
This report quantifies the clinical nutrition market across the US and UK (2025–2030), covering enteral, parenteral, and oral nutritional supplements (ONS). Driven by aging populations, chronic disease prevalence, and hospital malnutrition protocols, market value rises from $18.5B (2025) → $30.2B (2030) at a CAGR of 10.2%. Growth is led by enteral nutrition (48% share), followed by ONS (38%) and parenteral (14%). Hospital digitization, AI-based nutrition screening, and reimbursement parity accelerate adoption. ROI averages 16–22% for integrated hospital nutrition programs.
$ 1395

68 Circular Road, #02-01 049422, Singapore
Revenue Tower, Scbd, No.52-53, Jakarta 12190, Indonesia
Cinnabar Hills, Embassy Golf Links Business Park, Bengaluru, Karnataka 560071
4th Floor, Pinnacle Business Park, Andheri East, Mumbai, 400093


68 Circular Road, #02-01 049422, Singapore
Revenue Tower, Scbd, Jakarta 12190, Indonesia
4th Floor, Pinnacle Business Park, Andheri East, Mumbai, 400093
Cinnabar Hills, Embassy Golf Links Business Park, Bengaluru, Karnataka 560071