Jakarta Revenue Tower, Scbd, Jakarta 12190, Indonesia
Mumbai 4th Floor, Pinnacle Business Park, Andheri East, Mumbai, 400093
Bangalore Cinnabar Hills, Embassy Golf Links Business Park, Bengaluru, Karnataka 560071
Request Custom Transcript
Thank you for submitting the form
Oops! Something went wrong while submitting the form.
Expert Voices, Powerful Transcripts
TranscriptIQ replaces generic syndicated research with primary source intelligence, where expert calls are distilled into modular, searchable transcripts & on-point, analyst grade business reports.
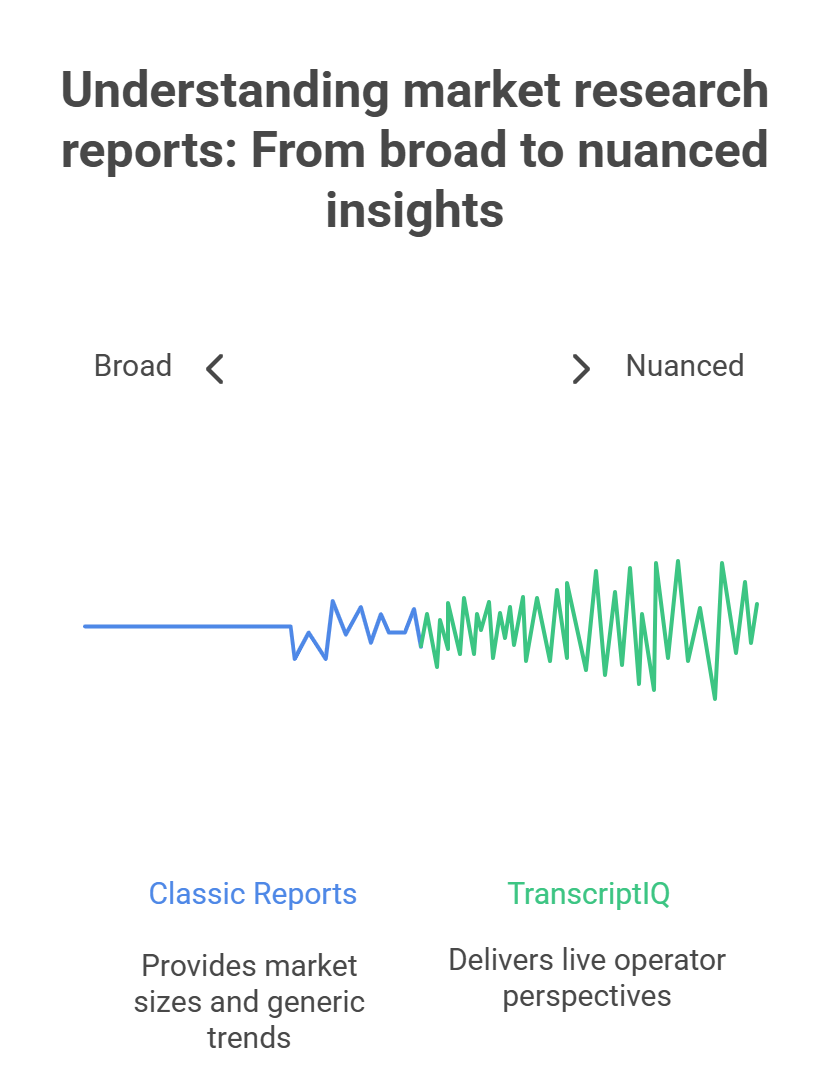
Classic syndicated market research is indispensable for broad strokes—market sizes, historical trends, competitor counts. But in turbulent markets, those PDFs age fast, and surface‑level stats rarely answer the why.
TranscriptIQ flips the model. We capture live operator perspectives through on‑demand expert conversations, then layer the rigor you expect from premium reports—KPIs, segmentation, competitive maps, and forecast signals—directly onto the transcript.
No last Year's Outlook - this week's operator moves.
No generic summaries - verbatim quotes, context-ready.
Everything you love in secondary reports plus first-hand nuance.
What Sets Us Apart
Built for professionals, our platform delivers structured, high-quality expert insights with exceptional speed and depth across niche and emerging industry segments.
Interviews with operators, execs & functional leaders—captured verbatim so you hear decisions straight from the source.
Modular Transcripts
Search by theme, quote, or KPI. Clip insights directly into decks and investment memos—zero re‑formatting.
Analyst Layer & KPIs
Every call is paired with an analyst‑written brief: market sizing, segmentation, business‑model heatmap, and forward signals.
No Fluff, Just Signals
Every transcript is curated to eliminate noise. We prioritize clarity, candor, and context — not scripted responses or generic commentary.
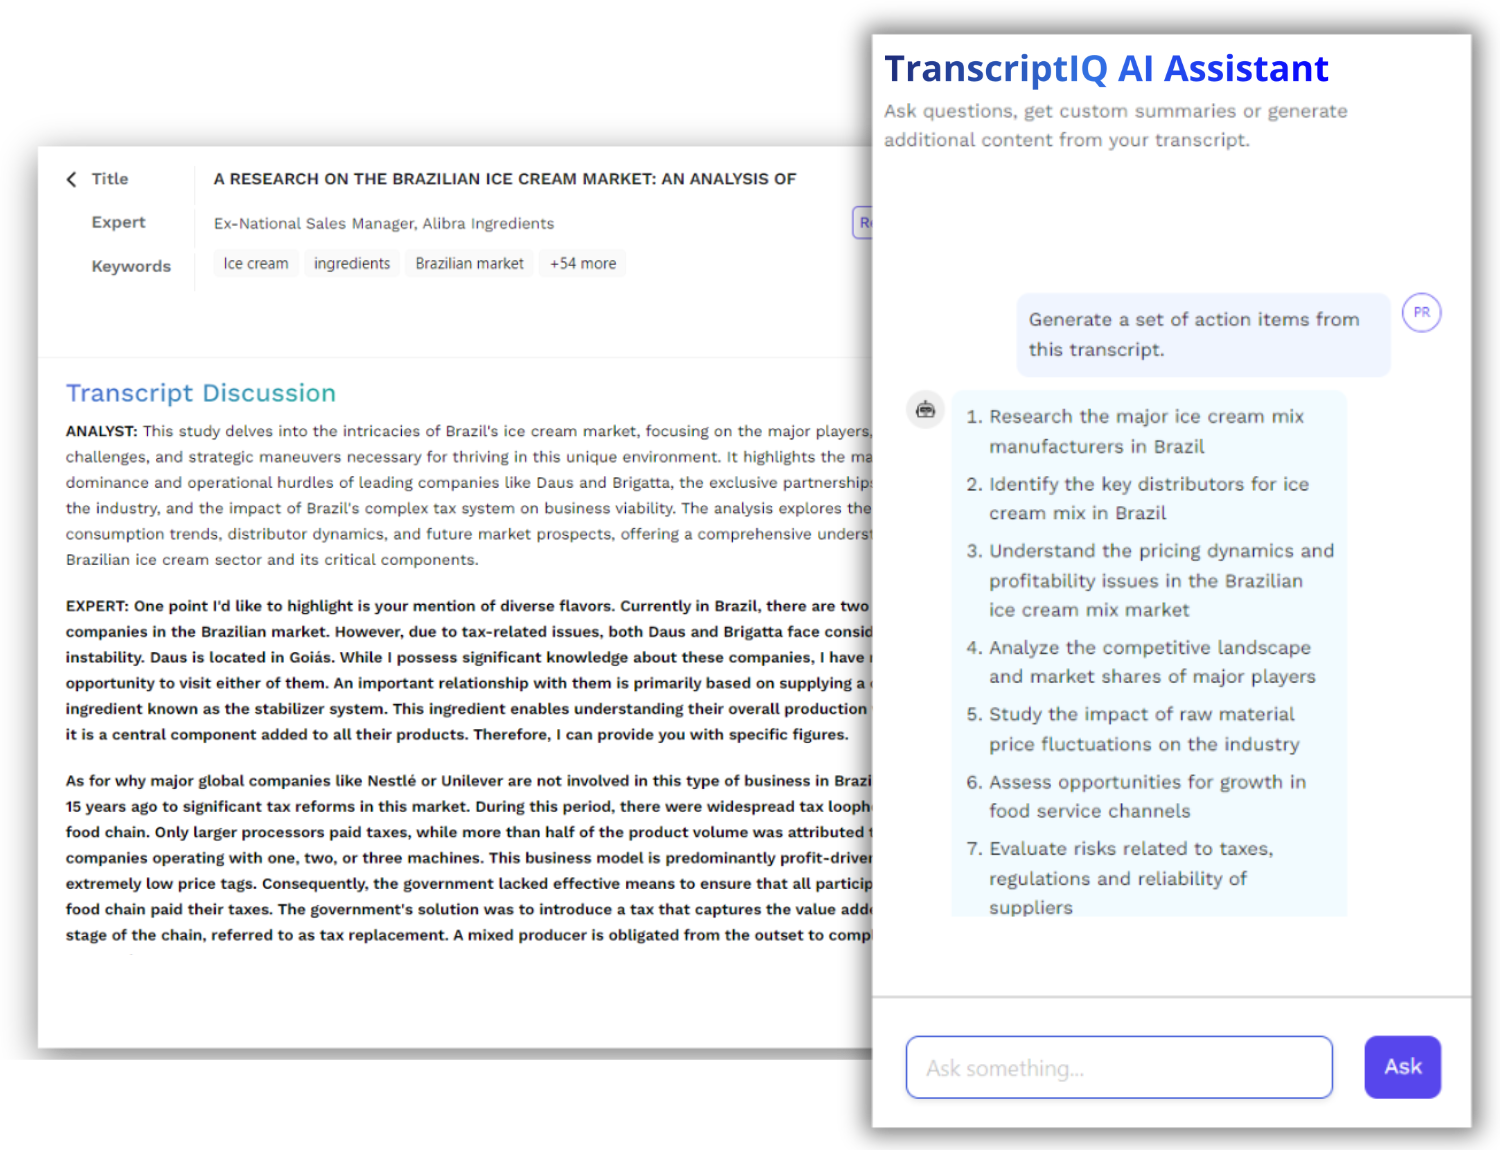
AI Dashboard
Chat with your transcripts, auto‑build charts, pull quotes—save hours vs skimming 80‑page PDFs.
Who Benefits from Our Transcripts?
Investment Firms
From early-stage VC to late-stage PE, our transcripts support better diligence and faster conviction.
Strategy Consulting Firms
Used by top-tier strategy teams to enrich client deliverables with real-world context.
Corporates
Stay ahead of market shifts and competitor moves through sector-specific expert insights.
From Conversations to Clarity: How Transcript IQ Delivers Precision Insights
Target What Truly Matters
We co-create research briefs and identify high-signal topics that cut through the clutter—keeping client goals at the core from day one.
Precision-Guided Scoping & Expert Curation
Our analysts architect sharp, vertical-specific questions and tap into curated expert pools to ensure each voice brings operational depth.
Structured Interviews. Actionable Intelligence.
Guided by strategic playbooks, trained analysts conduct interviews designed to extract rich, operator-grade insights—not just top-level chatter.
Modular Transcripts That Drive Impact
Every call is transcribed, reviewed, and transformed into reusable insight blocks—complete with annotated themes, industry maps, trends, and expert POVs.
Looking for Comprehensive Expert Transcripts?
Gain access to in-depth, structured transcripts from real conversations with industry experts. Designed for speed and clarity, our archive helps you uncover actionable insights without the wait.
Our FAQ section offers clear, detailed answers to help you understand how our curated transcripts deliver timely, high-quality insights — with structured content, deep industry coverage, and flexible access designed to support your decision-making.
What exactly is included in an expert call transcript?
Each transcript includes a verbatim conversation between a domain expert and a professional moderator. It is cleaned, anonymized (if required), and structured with thematic headers, and segmented insights for easy navigation.
How do you ensure the quality and accuracy of the transcripts?
Transcripts are generated using a combination of AI-driven speech recognition and human editorial oversight. This hybrid approach ensures clarity, accuracy, and contextual relevance — maintaining technical precision.
Are these transcripts from real conversations?
Yes, all transcripts are derived from real conversations conducted during primary research engagements with experts across industries and regions. However, confidential company specific information is never disclosed.
How is the content structured for ease of use?
Each transcript is tagged by title, keywords, industry, sub-industry & geography. Users also get access to a proprietary AI integrated tool that helps users search within transcripts and answer questions on the transcript, through a simple chat functionality.
Who are the experts featured in these transcripts?
Our transcripts feature senior professionals, decision-makers, and niche domain experts with firsthand experience in the topics discussed. These include former CXOs, operators, consultants, and subject matter experts across global markets — all carefully vetted by our in-house research team prior to the interview.
Can I request transcripts on specific topics or companies?
Yes. We offer on-demand transcript packs based on specific themes, companies, or sectors. You can submit a request, and we will curate and share relevant content within 24–48 hours.
How does this differ from traditional expert calls or research reports?
Unlike one-off expert calls or static reports that take hours to comprehend, transcripts provide scalable, reusable insights at speed — with structured data that allows for trend spotting, comparative analysis, and thematic exploration.
Is this service compliant with industry regulations and confidentiality standards?
Absolutely. All expert conversations are conducted within compliance frameworks (e.g., no MNPI, insider trading, etc.), and any sensitive expert or sensitive company information identifiers are removed before transcripts are published. In fact, our moderators are trained to ensure such information is never discussed over an expert conversation.
What are the access models — subscription, pay-per-view, or enterprise?
Our unique pay-per-transcript model, is a first of its kind offering. Additionally, we also offer flexible access models, including monthly subscriptions and enterprise packages for larger organizations.
How frequently is the transcript database updated?
The database is updated weekly, with new transcripts added from ongoing expert interviews conducted by our seasoned team of moderators.