

68 Circular Road, #02-01 049422, Singapore
Revenue Tower, Scbd, Jakarta 12190, Indonesia
4th Floor, Pinnacle Business Park, Andheri East, Mumbai, 400093
Cinnabar Hills, Embassy Golf Links Business Park, Bengaluru, Karnataka 560071


Connect With Us


68 Circular Road, #02-01 049422, Singapore
Revenue Tower, Scbd, Jakarta 12190, Indonesia
4th Floor, Pinnacle Business Park, Andheri East, Mumbai, 400093
Cinnabar Hills, Embassy Golf Links Business Park, Bengaluru, Karnataka 560071
Connect With Us
68 Circular Road, #02-01 049422, Singapore
Revenue Tower, Scbd, Jakarta 12190, Indonesia
4th Floor, Pinnacle Business Park, Andheri East, Mumbai, 400093
Cinnabar Hills, Embassy Golf Links Business Park, Bengaluru, Karnataka 560071
Request Custom Transcript
Compression Therapy Market Size & Share Analysis - Growth Trends & Forecasts.
This report quantifies the compression therapy market across the USA and EU (2025–2030), covering medical compression garments, multilayer bandage systems, intermittent pneumatic compression (IPC) pumps, and ancillary accessories. Market value rises from $4.6B (2025) to $7.5B (2030) at a CAGR ~10.3%, powered by aging demographics, chronic venous insufficiency (CVI), venous leg ulcers (VLU), lymphedema, and post-operative edema protocols. Growth accelerators include 3D body-scanning for custom fit, e-commerce/refill programs, and home-based IPC. Health systems report ulcer healing-time reductions 15–22%, recurrence −18–24%, and adherence +12–16 pp, yielding attractive, measurable ROI.
What's Covered?
Report Summary
Key Takeaways
- USA+EU market grows $4.6B → $7.5B (CAGR ~10.3%).
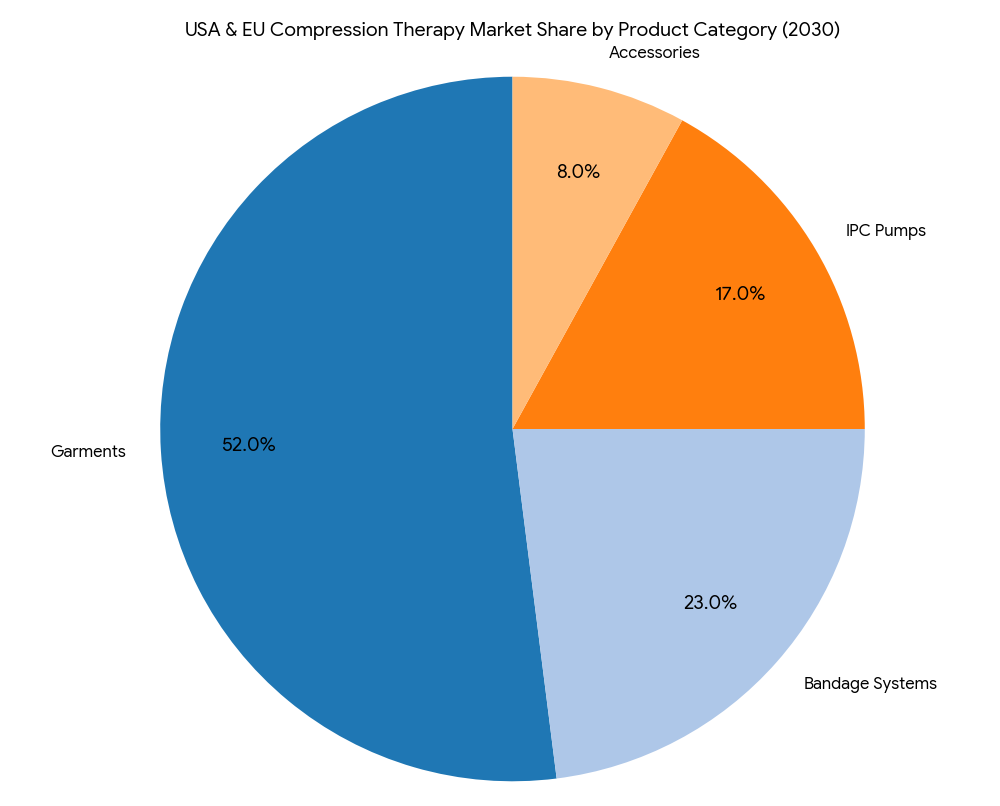
- Category mix (2030): garments 52%, bandage systems 23%, IPC pumps 17%, accessories/dressings 8%.
- CVI prevalence reaches ~68–72M adults combined; VLU incidence +14% vs 2025.
- Adherence uplift from digital sizing and education +12–16 pp.
- Ulcer healing times shorten 15–22%; recurrence −18–24% with standardized pathways.
- Home-care share of spend rises 21% → 31% by 2030.
- Custom-fit (3D scanned) garments expand 9% → 22% of garment sales.
- IPC in home settings grows $520M → $1.1B (CAGR ~16%).
- E-commerce/auto-refill accounts for 28% of OTS garments by 2030.
- Provider ROI 15–21%, payback 14–24 months via fewer clinic visits and lower wound-care supply use.
Key Metrics
Market Size & Share
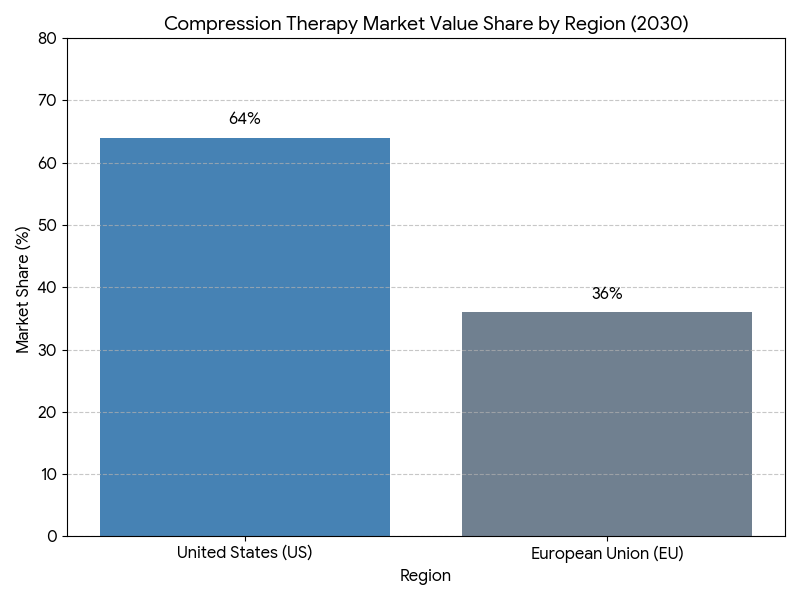
The USA & EU compression therapy market expands from $4.6B in 2025 to $7.5B in 2030 (CAGR ~10.3%), underpinned by a larger 65+ cohort and rising CVI/VLU/lymphedema caseloads. By 2030, category shares settle at garments 52%, bandage systems 23%, IPC pumps 17%, and accessories 8%. The garments segment remains dominant as prescribers favor graduated compression (20–30/30–40 mmHg) for VLU maintenance and CVI symptoms, while bandage systems retain importance for active ulcer phases requiring higher stiffness. IPC grows fastest (mid-teens CAGR) with payer acceptance of home-based edema management, reducing in-clinic time. The USA contributes ~64% of combined market value, EU ~36%; however, EU exhibits higher per-capita utilization in countries with strong district nursing models. Custom-fit garments—enabled by 3D scanning and flexible manufacturing—reach 22% of garment sales by 2030, improving fit precision and reducing returns. E-commerce and auto-refill capture 28% of OTS garments as replacement cycles are automated. Health systems adopting compression-first wound pathways report healing-time reductions of 15–22%, recurrence −18–24%, and clinic visits −10–14% for chronic VLU populations. Vendor consolidation yields the top 10 manufacturers controlling ~70% of revenue through integrated portfolios (garment + bandage + IPC), logistics reliability, and payer contracting expertise. Net effect: a larger, more protocolized market with measurable outcome gains and lower total cost of care.
Market Analysis
Five levers explain the growth curve. (1) Epidemiology: Expanded CVI and VLU burden drives baseline demand; combined USA+EU populations with chronic venous disease exceed ~68–72M adults by 2030, with VLU incidence up ~14% versus 2025 due to aging and metabolic comorbidities. (2) Protocolization: Standardized compression-first pathways increase therapy starts within 7 days of diagnosis, lifting adherence +12–16 pp and decreasing time-to-closure 15–22%. (3) Technology: 3D scanning and size-calculator apps reduce misfit returns −25–32%, while breathable yarns maintain target mmHg across wear cycles, reducing pressure decay −18–24% after 30 washes. (4) Site of care shift: Home-care share 21% → 31%; IPC rentals and remote check-ins reduce clinic utilization and transport costs. (5) Commercial model: E-commerce and auto-refill capture recurring revenue; subscription models raise on-time replacement +20–28%. Financially, providers adopting integrated programs show supply spend −8–12% and wound-clinic minutes per patient −10–15%; payers observe episode cost −9–13% from fewer recurrences. Sensitivities: every +10 pp increase in adherence correlates with ~9–11% shorter healing durations; garments with documented mmHg stability over 30 cycles deliver ~6–8% fewer recurrences at 12 months. Risks include non-wear due to discomfort, fit errors, and documentation gaps delaying reimbursement—mitigated via tiered compression education, digital sizing, and templated chart notes fulfilling medical necessity criteria.
Trends & Insights
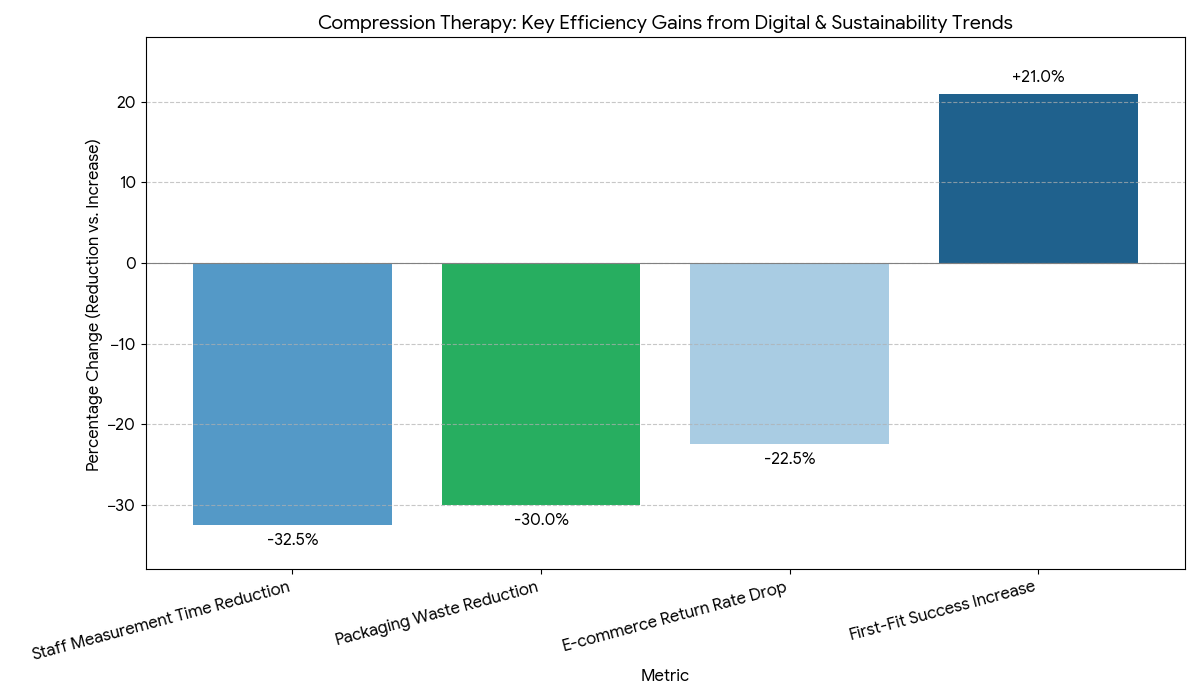
Digital adherence and fitting lead 2025–2030 innovation. Health systems deploy mobile sizing tools that recommend SKUs and capture limb measurements, lifting first-fit success +18–24% and reducing staff measurement time −30–35%. Smart garments with embedded wear-time sensors (non-battery NFC/QR logging) enter pilots, raising verified adherence +10–14 pp without patient burden. Material science trends favor microfiber and heat-dissipating blends, boosting comfort scores and summer wear compliance. IPC at home integrates with telewound platforms; automated session logs drive reimbursement confidence and utilization >80% of prescribed cycles. E-commerce matures with auto-refill nudges tied to expected elasticity loss dates; return rates drop −20–25% as fit histories inform reorders. Care bundles pair compression with advanced dressings and education kits, improving 12-month recurrence −18–24%. Sustainability emerges as a differentiator: recycled-yarn lines and paperless IFUs target packaging waste −30%. Coding clarity improves in both regions, accelerating prior auth decisions to ≤5 business days in programs with structured documentation. Finally, equity initiatives provide low-cost stockings through community pharmacies, shrinking non-initiation due to affordability. Collectively, these trends shift compression therapy from a product purchase to a managed, data-informed program with predictable outcomes.
Segment Analysis
By product, garments (52%) dominate maintenance and mild-to-moderate edema; bandage systems (23%) serve acute VLU phases needing higher working pressure and stiffness; IPC pumps (17%) address refractory edema and lymphedema and expand in home-care; accessories (8%) include donning aids, liners, and pressure monitors. By pressure class, 20–30 mmHg holds the largest volume for daily CVI use; 30–40 mmHg grows in VLU maintenance; specialty classes (>40 mmHg) stay niche. By channel, hospital/clinic accounts for 49% of 2025 revenue, dropping to 44% by 2030; home-care and DME rise to 31%; retail/e-commerce reaches 25%. By customization, OTS remains majority, while custom-fit rises to 22% of garment sales with 3D scanning. By indication, VLU (38%), CVI symptoms (34%), lymphedema (18%), post-surgical/other (10%). Outcome segmentation shows standardized VLU pathways achieving time-to-closure −19%; custom-fit cohorts display adherence +14 pp; IPC-inclusive pathways reduce persistent edema −22–28% vs garments alone. Economic segmentation: subscription/e-commerce programs deliver on-time replacement +20–28% and return rate −20–25%; home IPC rentals shift CapEx to OpEx and improve utilization tracking. Winners offer complete portfolios, digital sizing, education kits, and transparent mmHg stability across wash cycles.
Geography Analysis
The USA contributes ~64% of combined market value by 2030, reflecting larger absolute patient pools and broader private insurance coverage. Adoption accelerates through care pathways embedded in wound centers and Medicare/Medicaid alignment for stockings and IPC rentals (where medically necessary). US providers report adherence +12–15 pp and clinic visits −10–13% after launching digital sizing and auto-refill. The EU holds ~36% of value, with Germany, France, UK, Italy, Spain leading volumes; community nursing models and established compression guidelines drive higher per-capita utilization. EU programs achieve healing-time −16–22% and recurrence −18–24%, supported by district nurse application and bandage expertise. Custom-fit penetration is higher in DACH/Benelux due to reimbursement for made-to-measure products, while Southern Europe grows via OTS and education-first models. Home-care share expands faster in the USA (+11 pp) due to IPC at home; the EU’s growth concentrates in custom garments and bandage training. Cross-region commonalities include e-commerce replacement cycles, compression-first protocols, and documentation templates that speed authorizations to ≤5 business days in organized programs. By 2030 both regions converge on data-enabled compression management, with measurable improvements in adherence, recurrence, and clinic throughput.
Competitive Landscape
The field is moderately consolidated. Global leaders combine garments + bandage systems + IPC with education and digital tools. Differentiators include accurate graduated pressure, mmHg stability after 30–40 wash cycles, size inclusivity, donning aids, and 3D scanning workflows. Vendors with telewound integrations and adherence analytics win system-wide contracts. Pricing remains stable (annual list increases 2–3%), offset by value-based agreements tied to healing-time and recurrence outcomes. E-commerce/auto-refill partnerships with hospital systems drive recurring revenue and higher replacement compliance. Suppliers investing in breathable microfibers, anti-slip weaves, and sustainability (recycled yarns, recyclable packaging) gain share. Service leaders provide nurse education, protocol kits, and documentation templates to streamline prior auth. Buyers increasingly demand pressure verification data, SKU rationalization maps, and device-utilization dashboards for IPC fleets. Contract KPIs include on-time fill ≥98%, return rate ≤6%, documented mmHg stability, and adherence uplift ≥10 pp within 6–9 months of program start. Top performers pair product breadth with programmatic execution—digital fit, education, e-commerce, and analytics—converting compression from a transactional supply to a managed therapy with predictable outcomes and ROI.
Report Details
Proceed To Buy
Want a More Customized Experience?
- Request a Customized Transcript: Submit your own questions or specify changes. We’ll conduct a new call with the industry expert, covering both the original and your additional questions. You’ll receive an updated report for a small fee over the standard price.
- Request a Direct Call with the Expert: If you prefer a live conversation, we can facilitate a call between you and the expert. After the call, you’ll get the full recording, a verbatim transcript, and continued platform access to query the content and more.
68 Circular Road, #02-01 049422, Singapore
Revenue Tower, Scbd, Jakarta 12190, Indonesia
4th Floor, Pinnacle Business Park, Andheri East, Mumbai, 400093
Cinnabar Hills, Embassy Golf Links Business Park, Bengaluru, Karnataka 560071
Request Custom Transcript
Related Transcripts


68 Circular Road, #02-01 049422, Singapore
Revenue Tower, Scbd, No.52-53, Jakarta 12190, Indonesia
Cinnabar Hills, Embassy Golf Links Business Park, Bengaluru, Karnataka 560071
4th Floor, Pinnacle Business Park, Andheri East, Mumbai, 400093


68 Circular Road, #02-01 049422, Singapore
Revenue Tower, Scbd, Jakarta 12190, Indonesia
4th Floor, Pinnacle Business Park, Andheri East, Mumbai, 400093
Cinnabar Hills, Embassy Golf Links Business Park, Bengaluru, Karnataka 560071