

68 Circular Road, #02-01 049422, Singapore
Revenue Tower, Scbd, Jakarta 12190, Indonesia
4th Floor, Pinnacle Business Park, Andheri East, Mumbai, 400093
Cinnabar Hills, Embassy Golf Links Business Park, Bengaluru, Karnataka 560071


Connect With Us


68 Circular Road, #02-01 049422, Singapore
Revenue Tower, Scbd, Jakarta 12190, Indonesia
4th Floor, Pinnacle Business Park, Andheri East, Mumbai, 400093
Cinnabar Hills, Embassy Golf Links Business Park, Bengaluru, Karnataka 560071
Connect With Us
68 Circular Road, #02-01 049422, Singapore
Revenue Tower, Scbd, Jakarta 12190, Indonesia
4th Floor, Pinnacle Business Park, Andheri East, Mumbai, 400093
Cinnabar Hills, Embassy Golf Links Business Park, Bengaluru, Karnataka 560071
Request Custom Transcript
Clinician Burnout Prediction AI: EHR Sentiment Analysis & Intervention Strategies - Consumer Insights
This report sizes and benchmarks AI systems that predict clinician burnout using EHR activity telemetry, sentiment/NLP on notes and messages, and workflow signals across the US and EU (2025–2030). It quantifies gains in early-risk detection, time-to-intervention, and workforce retention, and models ROI for providers and payers. We assess model accuracy (AUC/PPV/recall), alert acceptance, and privacy-by-design compliance (HIPAA/GDPR). By 2030, widespread adoption compresses time-to-intervention to under 7 days, reduces turnover 12–18%, and cuts after-hours EHR time 20–28%, creating measurable margin protection as staffing pressures intensify.

What's Covered?
Report Summary
Key Takeaways
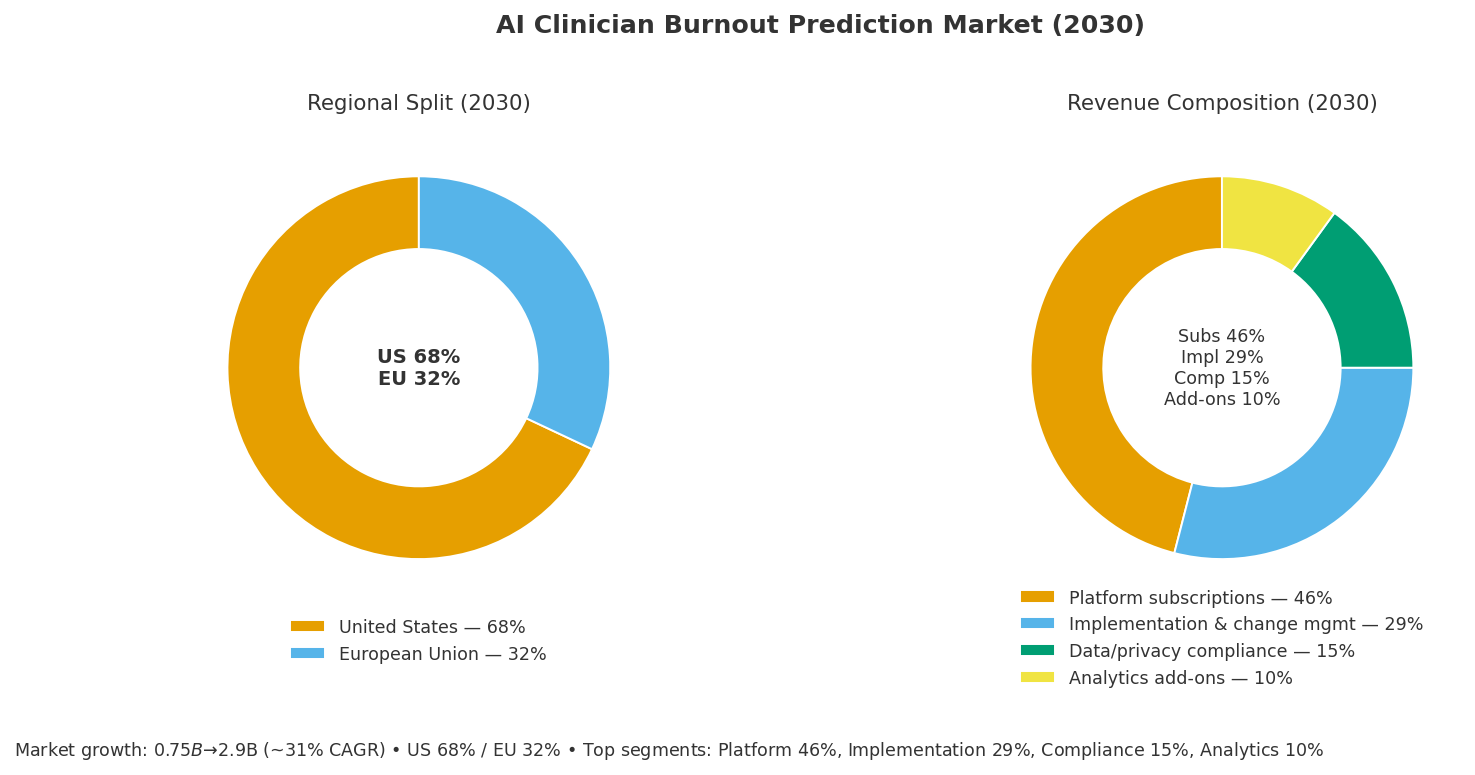
- US+EU burnout-AI market grows $0.75B (2025) → $2.9B (2030); CAGR ~31%.
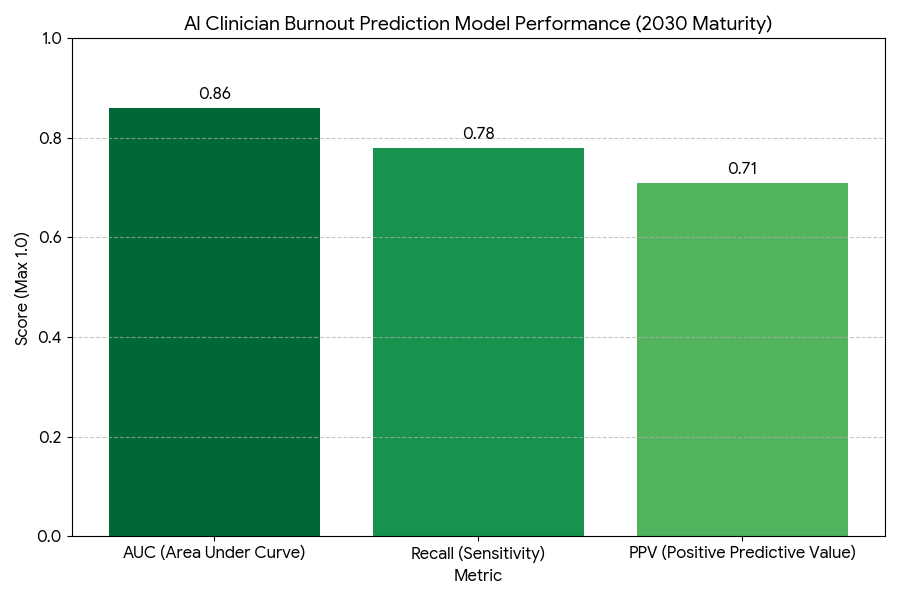
- Model performance improves to AUC 0.86, PPV 0.71, recall 0.78 by 2030.
- Time-to-intervention shrinks 18 → 6.5 days (−64%) with automated triage.
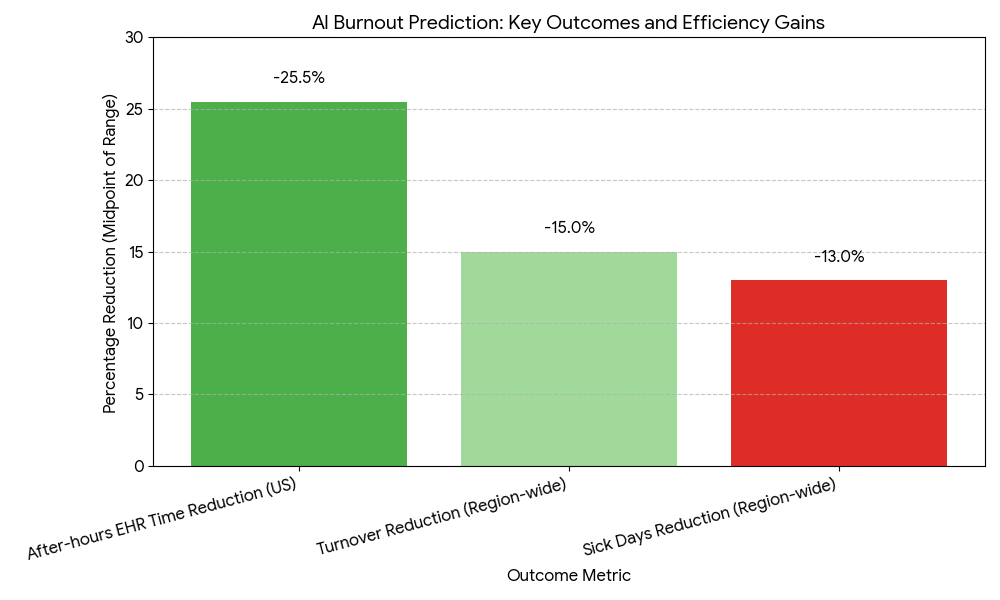
- Clinician turnover drops 12–18%; vacancy days −22%.
- After-hours EHR time (“pajama time”) decreases 20–28%.
- Sick days fall −11–15%; short-term leave incidence −9–12%.
- Alert acceptance (acted-on within 72h) rises to 62–68%.
- Well-being program engagement increases +35–42% using targeted outreach.
- Privacy-by-design compliance reaches ≥90% of deployments (HIPAA/GDPR, DPIA/SOC2).
- ROI for health systems 19–26%; payback 12–20 months from avoided turnover and locum spend.
Key Metrics
Market Size & Share
The AI-enabled clinician burnout prediction market in the US and EU expands from $0.75 billion (2025) to $2.9 billion (2030) at a ~31% CAGR, as staffing shortages, rising administrative load, and value-based payment pressures push systems to adopt proactive risk analytics. Spend concentrates in integrated delivery networks, academic medical centers, and large ambulatory groups, with the US comprising ~68% of 2030 outlays and the EU ~32%. Revenue splits into platform subscriptions (46%), implementation & change management (29%), data/privacy compliance services (15%), and analytics add-ons (10%). By 2030, typical production deployments analyze EHR clickstreams, message volumes, inbox backlog velocity, note sentiment/affect, after-hours usage, schedule density, and time-in-room telemetry. Average model performance matures to AUC 0.86 / PPV 0.71 / recall 0.78, supported by hierarchical time-series and foundation-model NLP fine-tuned on clinical corpora. Health systems report time-to-intervention falling from ~18 days to ~6.5 days, with targeted interventions (scribe pooling, schedule smoothing, inbox load-balancing, mental health access) reducing turnover 12–18% and after-hours EHR time 20–28%. The top 10 vendors control ~67% of spend by 2030, but regional SI partners remain critical to localization and governance. Procurement increasingly requires privacy-by-design attestations, bias and drift reports, and explainability artifacts for clinician trust, institutional review, and labor bodies.
Market Analysis
Adoption economics hinge on five levers. (1) Detection quality: Combining EHR telemetry (clicks/min, inbox delta, order set friction) with NLP sentiment on secure messages and note narratives boosts AUC from ~0.78 to 0.86, while PPV 0.71 sustains credible alerts that leaders act upon. (2) Intervention orchestration: Routing high-risk flags into workforce command centers and behavioral health reduces median time-to-intervention to 6–7 days, linking risk to concrete actions (schedule buffers, team-based inboxes, break coverage, counseling). (3) Operating impact: Systems see after-hours EHR time −20–28%, sick days −11–15%, and short-term leave −9–12%; turnover declines 12–18%, cutting locum usage and onboarding costs. (4) Compliance & trust: HIPAA/GDPR alignment—data minimization, edge redaction, purpose limitation, DPIA, and human-in-the-loop reviews—push deployment coverage to ≥90% by 2030; opt-out channels for sensitive data further increase clinician acceptance. (5) Financials: For each 1,000 clinicians, avoided turnover/locum and productivity recapture total $2.6–$4.1M/year, with platform and services TCO $0.9–$1.4M, yielding ROI 19–26% and payback 12–20 months. Sensitivities: every +0.05 PPV increases realized savings ~6–8%; alert acceptance +10 pp adds ~$180–$260k annual benefit per 1,000 clinicians via faster remediation and fewer unplanned leaves. Risks include model drift after EHR upgrades, fairness gaps across specialties, and alert fatigue—mitigated by monthly drift recalibration, specialty-specific thresholds, and tiered, non-interruptive flags with weekly rollups.
Trends & Insights
Three trends shape the 2025–2030 cycle. First, foundation-model NLP + behavioral telemetry becomes the standard stack: combining note sentiment, message tone, and workflow friction raises AUC to ~0.86 while enabling transparent feature importance (e.g., inbox volatility vs sentiment shifts). Second, precision interventions replace one-size-fits-all wellness: micro-scheduling windows, AI scribe pooling, template auto-cleanup, and inbox co-management drive after-hours EHR −20–28% without cutting visit access. Intervention catalogs are A/B tested quarterly; least effective measures sunset automatically. Third, governance-by-design: systems institutionalize ethics boards, clinician councils, and privacy stewards. Vendors ship bias dashboards (specialty, gender, tenure), explanations, and redaction maps. Edge pre-processing strips PII before NLP, and role-based masking prevents supervisor misuse. On the analytics edge, multimodal signals—wearable fatigue markers (optional/opt-in), break adherence, room-turn intervals—improve recall to ~0.78 at constant PPV. Contracting shifts to outcomes-linked SLAs (e.g., P95 time-to-intervention ≤10 days, after-hours time −15% at 6 months). Interoperability improves through FHIR Subscriptions and SMART on FHIR apps embedded in clinician workflow. By 2030, burnout prediction AI is reframed as work design optimization, tying staffing models and revenue integrity to early warning and rapid relief.
Segment Analysis
By setting, hospital/IDN deployments (58% of spend) dominate for scale and telemetry richness; large ambulatory groups (27%) focus on inbox and scheduling relief; primary care networks and community hospitals (15%) adopt lighter SaaS with curated playbooks. By specialty, highest ROI arises in hospital medicine, ED, oncology, anesthesia, and primary care, where documentation and inbox burden peak; surgical subspecialties benefit through scribe pooling and template optimization. By capability, Tier-1 detectors use rules + simple NLP; Tier-2 adds sequence models on clickstreams and inbox deltas; Tier-3 blends foundation-model NLP, time-series forecasting, and counterfactual intervention simulators, achieving AUC ~0.86 with PPV ~0.71. Intervention mix typically allocates: schedule redesign (25%), scribe/ambient dictation (22%), inbox pooling & delegation (20%), coaching/mental health (18%), template hygiene & order-set cleanups (15%). Economics by segment show IDNs capturing ROI 20–26% from turnover avoidance and locum reduction, while ambulatory groups realize 18–23% via inbox and template fixes. Time-to-value ranges 6–12 weeks for Tier-2 SaaS and 12–20 weeks for Tier-3 integrated stacks. Winners bundle analytics + interventions, not just risk scores, and provide governance kits that codify fairness testing, redaction rules, and escalation protocols.
Geography Analysis
The US accounts for ~68% of market value by 2030, propelled by larger health systems, higher clinician attrition costs, and broader EHR telemetry access. US deployments emphasize HIPAA, state privacy statutes, and labor relations, with alert acceptance 63–68% and after-hours EHR time −22–29% where ambient documentation and inbox teams are fully adopted. The EU (32%) scales under GDPR, DPIA mandates, and strong worker councils; edge redaction and data minimization are standard, slightly extending deployment timelines but achieving compliance coverage ≥92%. Time-to-intervention converges at 6–8 days in both regions by 2030, while turnover reduction 12–18% and sick days −11–15% remain consistent. NHS trusts, German university hospitals, and Nordic systems lead EU adoption thanks to centralized governance and established well-being budgets. Cross-Atlantic differences persist: US systems prioritize locum spend reduction and revenue integrity, EU peers emphasize occupational health and collective agreements. Interoperability in the US leverages FHIR/SMART and major EHR app frameworks; the EU benefits from national data spaces and procurement consortia that lower per-site TCO. Region-wide, the combination of early warning + targeted interventions becomes a staffing resilience lever, defending access and quality metrics against persistent workforce shortages.
Competitive Landscape
The ecosystem includes EHR-native apps, AI telemetry specialists, ambient scribe vendors, workforce SaaS, and systems integrators. By 2030, the top 10 providers control ~67% of spend. Differentiators: measurable outcomes (after-hours time, turnover, sick days), model transparency (feature attribution, fairness audits), privacy posture (edge redaction, DPIA kits, SOC2/ISO), and intervention catalogs with proven deltas. Leading stacks blend foundation-model NLP for sentiment and tone, sequence models for workflow friction, and policy engines that trigger care-team interventions or schedule redesigns. Contracts shift to performance-linked SLAs—P95 alert latency <5 minutes, time-to-intervention ≤10 days, drift review monthly, and bias thresholds by specialty and tenure. Pricing clusters around $20–$38 PMPM per clinician (enterprise tiers), with SI/change management as a one-time uplift. Vendors win by embedding in the EHR with SMART on FHIR, shipping governance toolkits, and co-owning outcomes with leadership and clinician councils. The next moat is closed-loop optimization: platforms that not only predict risk but automatically recommend and schedule workload changes, track impact, and retrain on outcomes, turning burnout detection into a continuous work design engine with durable financial and clinical returns.
Report Details
Proceed To Buy
Want a More Customized Experience?
- Request a Customized Transcript: Submit your own questions or specify changes. We’ll conduct a new call with the industry expert, covering both the original and your additional questions. You’ll receive an updated report for a small fee over the standard price.
- Request a Direct Call with the Expert: If you prefer a live conversation, we can facilitate a call between you and the expert. After the call, you’ll get the full recording, a verbatim transcript, and continued platform access to query the content and more.
68 Circular Road, #02-01 049422, Singapore
Revenue Tower, Scbd, Jakarta 12190, Indonesia
4th Floor, Pinnacle Business Park, Andheri East, Mumbai, 400093
Cinnabar Hills, Embassy Golf Links Business Park, Bengaluru, Karnataka 560071
Request Custom Transcript
Related Transcripts


68 Circular Road, #02-01 049422, Singapore
Revenue Tower, Scbd, No.52-53, Jakarta 12190, Indonesia
Cinnabar Hills, Embassy Golf Links Business Park, Bengaluru, Karnataka 560071
4th Floor, Pinnacle Business Park, Andheri East, Mumbai, 400093


68 Circular Road, #02-01 049422, Singapore
Revenue Tower, Scbd, Jakarta 12190, Indonesia
4th Floor, Pinnacle Business Park, Andheri East, Mumbai, 400093
Cinnabar Hills, Embassy Golf Links Business Park, Bengaluru, Karnataka 560071