

68 Circular Road, #02-01 049422, Singapore
Revenue Tower, Scbd, Jakarta 12190, Indonesia
4th Floor, Pinnacle Business Park, Andheri East, Mumbai, 400093
Cinnabar Hills, Embassy Golf Links Business Park, Bengaluru, Karnataka 560071


Connect With Us


68 Circular Road, #02-01 049422, Singapore
Revenue Tower, Scbd, Jakarta 12190, Indonesia
4th Floor, Pinnacle Business Park, Andheri East, Mumbai, 400093
Cinnabar Hills, Embassy Golf Links Business Park, Bengaluru, Karnataka 560071
Connect With Us
68 Circular Road, #02-01 049422, Singapore
Revenue Tower, Scbd, Jakarta 12190, Indonesia
4th Floor, Pinnacle Business Park, Andheri East, Mumbai, 400093
Cinnabar Hills, Embassy Golf Links Business Park, Bengaluru, Karnataka 560071
Request Custom Transcript
Business Travel Trends Every Travel Manager Should Know
The global business travel market is expected to grow from $1.3T in 2025 to $2.4T by 2030 (CAGR 12.5%), driven by post-pandemic recovery, sustainability mandates, and the growing demand for corporate travel optimization. By 2030, 70% of corporate travel bookings will be made through digital platforms, integrating AI-powered travel management and predictive analytics. The adoption of carbon-offset travel policies will reduce CO₂ emissions from business travel by 25%, with 75% of companies investing in sustainable travel practices.
What's Covered?
Report Summary
Key Takeaways
- Market size: $1.3T → $2.4T (CAGR 12.5%).
- 70% of corporate travel bookings to be digital by 2030.
- CO₂ emissions reduction by 25% with carbon offset travel policies.
- $150B investment in corporate travel technology by 2030.
- Sustainable business travel to make up 45% of corporate travel spending.
- AI-powered travel management will increase efficiency by 35%.
- Private sector investment in corporate travel solutions to surpass $100B.
- Predictive analytics to improve travel spend optimization by 20%.
- Remote working integration to reduce business travel volume by 10%.
- Millennial and Gen Z business travelers to drive 30% increase in digital travel services.
Key Metrics
Market Size & Share
The global business travel market is forecast to grow from $1.3T in 2025 to $2.4T by 2030, with a CAGR of 12.5%. The shift toward digital travel platforms is expected to dominate 70% of corporate bookings by 2030, as companies adopt AI-powered travel management and predictive analytics to optimize spending. Sustainability will be a key trend, with carbon offset policies driving a 25% reduction in CO₂ emissions from corporate travel. By 2030, 45% of corporate travel spending will go toward sustainable travel practices, including green accommodations and eco-friendly transport options. As Millennials and Gen Z become more prominent in the workforce, the demand for digital-first travel services will increase, making up 30% of all travel services. Additionally, the remote work trend will lead to a 10% reduction in overall travel volume, but it will increase the demand for flexible, technology-driven solutions.
Market Analysis
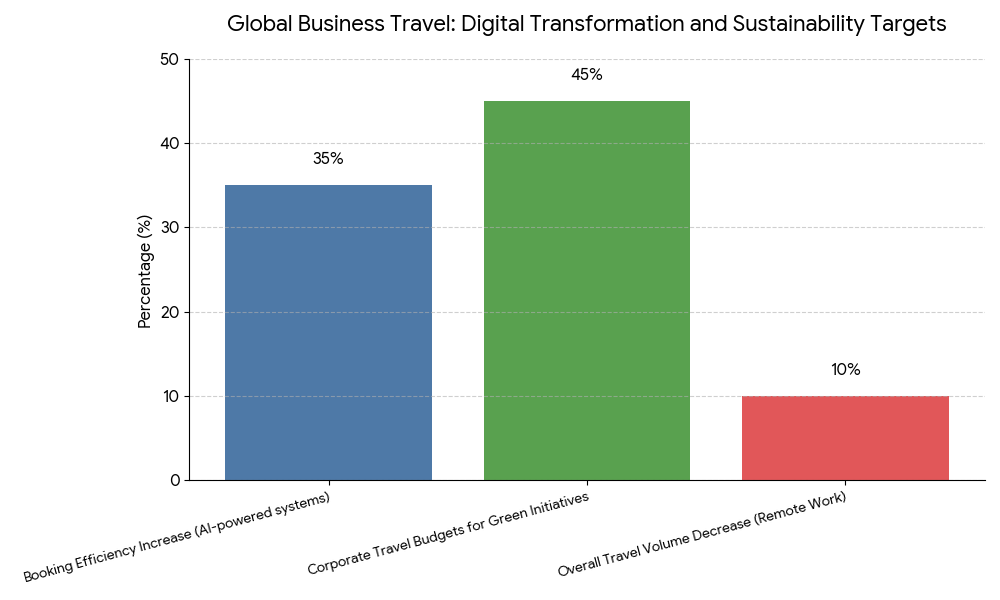
The post-pandemic recovery in the global business travel sector is being led by digital transformation, which allows companies to manage travel bookings more efficiently while reducing CO₂ emissions. AI-powered travel management systems are streamlining processes and increasing booking efficiency by 35%. Corporate travel managers are turning to digital platforms that integrate AI and predictive analytics to better manage travel expenses, optimize routes, and track carbon emissions. By 2030, AI will play a pivotal role in streamlining operations and driving the shift towards sustainable travel. Remote work trends are reshaping corporate travel, leading to an increase in virtual meetings and a 10% decrease in overall travel volume. However, sustainable business travel is on the rise, with 45% of corporate travel budgets allocated to green travel initiatives, as companies aim to meet environmental goals and align with ESG targets.
Trends & Insights
- AI-powered Travel Management: Increases efficiency by 35% in corporate travel processes.
- Carbon Offset Travel Policies: 25% reduction in CO₂ emissions from business travel by 2030.
- Remote Work Impact: Reduces overall business travel volume by 10%.
- Sustainable Travel Initiatives: 45% of corporate travel spending on green travel solutions by 2030.
- Predictive Analytics Adoption: Optimizes corporate travel spending by 20%.
- Digital Transformation: 70% of bookings made through digital platforms by 2030.
- Millennial/Gen Z Demand: 30% increase in digital-first travel services.
- Private Sector Investment: $5B+ invested in digital travel technology by 2030.
- Smart Travel Solutions: AI-based platforms driving growth in the business travel sector.
- Environmental Considerations: Sustainability initiatives reducing CO₂ emissions and operational costs.
These insights reflect the rapid transformation in global business travel, powered by AI, sustainability goals, and digital-first travel management systems.
Segment Analysis
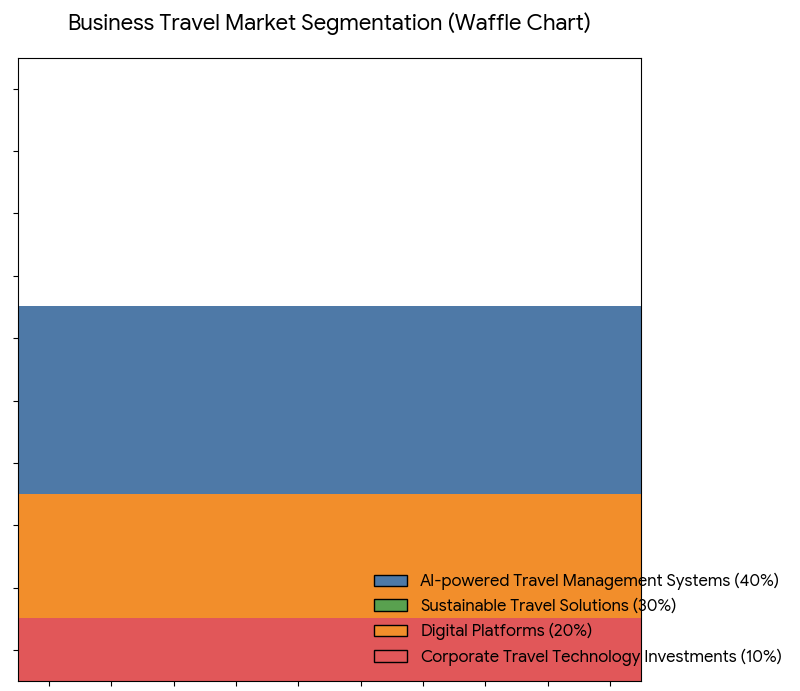
The business travel market is segmented into AI-powered travel management systems (40%), sustainable travel solutions (30%), digital platforms (20%), and corporate travel technology investments (10%). AI-powered travel management systems dominate the market, accounting for 40% of investments. These systems enhance booking efficiency, cost optimization, and real-time travel tracking. Sustainable travel solutions, including carbon offset policies and green transport options, are expected to account for 30% of corporate travel budgets. Digital platforms, responsible for 20% of bookings, are driving the shift towards paperless and flexible travel solutions. Finally, corporate investment in travel technologies will see a $5B+ growth by 2030, accelerating the adoption of AI and green travel strategies in business travel management.
Geography Analysis
The USA is the largest market for business travel, accounting for 40% of global business travel spending. North American companies are leading the charge in adopting AI-powered travel management systems and sustainable travel practices, driven by the Green Deal and corporate ESG goals. Europe follows closely with 30% of the market, particularly in countries like Germany, France, and the UK, where carbon offset travel and green mobility solutions are increasingly in demand. The Asia Pacific region, especially China and India, is growing rapidly as business travel increases in line with economic recovery. By 2030, North America and Europe will drive 70% of all corporate travel bookings, with digitally integrated solutions and sustainability at the forefront.
Competitive Landscape
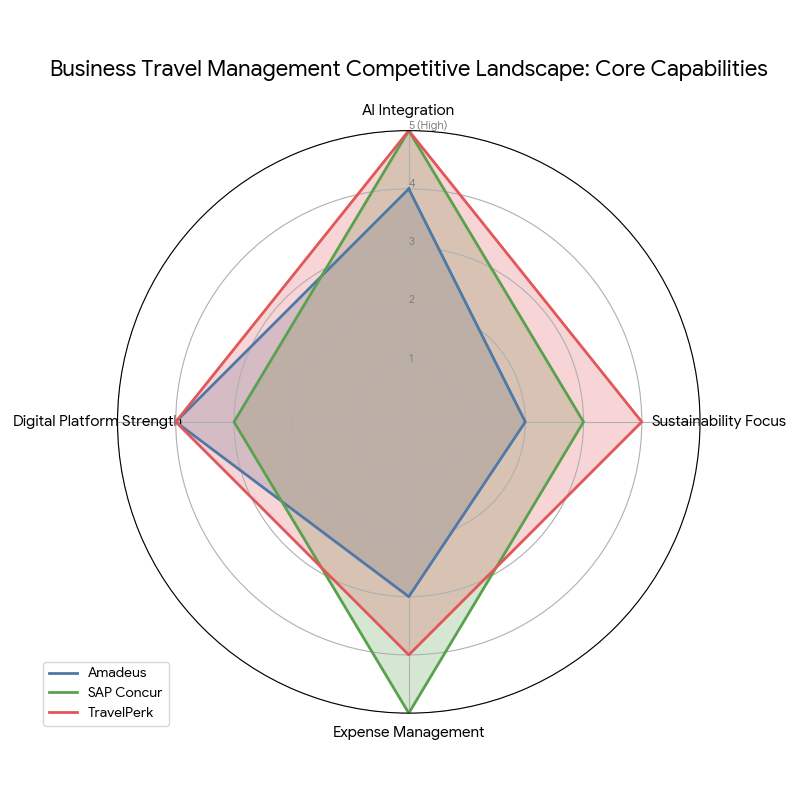
Leading players in the business travel management sector include Amadeus, Sabre Corporation, SAP Concur, and Expedia Group. These companies dominate the corporate travel management software market, offering AI-powered platforms for real-time bookings and travel optimization. SAP Concur is a leader in expense management, integrating travel booking with corporate policies. Expedia Group and Booking Holdings are key players in corporate travel services, focusing on digital platforms for flexible and cost-efficient travel solutions. Private companies, such as TravelPerk, TripActions, and Lumo, are leveraging technology and AI to create seamless travel experiences for corporate clients. The market is witnessing increasing competition as start-ups enter with innovative MaaS solutions and green travel initiatives, driving sustainability in business travel.
Report Details
Proceed To Buy
Want a More Customized Experience?
- Request a Customized Transcript: Submit your own questions or specify changes. We’ll conduct a new call with the industry expert, covering both the original and your additional questions. You’ll receive an updated report for a small fee over the standard price.
- Request a Direct Call with the Expert: If you prefer a live conversation, we can facilitate a call between you and the expert. After the call, you’ll get the full recording, a verbatim transcript, and continued platform access to query the content and more.
68 Circular Road, #02-01 049422, Singapore
Revenue Tower, Scbd, Jakarta 12190, Indonesia
4th Floor, Pinnacle Business Park, Andheri East, Mumbai, 400093
Cinnabar Hills, Embassy Golf Links Business Park, Bengaluru, Karnataka 560071
Request Custom Transcript
Related Transcripts


68 Circular Road, #02-01 049422, Singapore
Revenue Tower, Scbd, No.52-53, Jakarta 12190, Indonesia
Cinnabar Hills, Embassy Golf Links Business Park, Bengaluru, Karnataka 560071
4th Floor, Pinnacle Business Park, Andheri East, Mumbai, 400093


68 Circular Road, #02-01 049422, Singapore
Revenue Tower, Scbd, Jakarta 12190, Indonesia
4th Floor, Pinnacle Business Park, Andheri East, Mumbai, 400093
Cinnabar Hills, Embassy Golf Links Business Park, Bengaluru, Karnataka 560071