This research examines the AI-powered drug discovery ecosystem in the UK and EU (2025–2030), focusing on strategic integration across preclinical research, molecule design, and clinical translation. It quantifies AI’s role in time-to-candidate reduction, cost optimization, and success-rate improvement. The report analyzes R&D investment trends, collaborative pipelines, and regulatory adaptation supporting AI models in medicinal chemistry. Designed for pharma, biotech, and AI vendors, it highlights efficiency gains, competitive advantages, and emerging compliance frameworks reshaping European drug innovation.
The AI-powered drug discovery market in the UK and EU is forecast to rise from €1.6 billion (2025) to €8.7 billion (2030), a robust CAGR of 42%. Growth stems from rapid adoption of machine-learning molecular screening, AI-assisted compound prioritization, and predictive toxicity analytics across preclinical stages. By 2030, AI-driven modeling will contribute to 70% of all active R&D programs. Candidate identification timelines drop from 4.1 to 2.4 years (–42%), while preclinical success rates climb from 32% to 52%, as algorithms refine compound-target affinity and ADMET profiling. Discovery costs fall 35%, from €180 M to €117 M per molecule, with generative AI design improving hit-rate efficiency 2.3×. Hybrid lab integration reduces assay failure –30% by early elimination of poor candidates. Cross-border collaborations between UK and EU pharma firms rise 40%, supported by harmonized R&D tax incentives and joint AI infrastructures. Regulatory acceptance of AI-derived preclinical evidence is expected to reach 80%, driving faster Investigational New Drug (IND) submissions. ROI for integrated AI-R&D ecosystems is projected at 22–27%, anchored in accelerated timelines and reduced attrition. By 2030, AI will not merely supplement but strategically orchestrate discovery pipelines, transforming Europe into a global hub for intelligent drug innovation.
Between 2025–2030, AI integration across UK/EU drug discovery will redefine R&D economics. The market’s €8.7 billion value by 2030 reflects consolidation of AI vendors, CROs, and pharma alliances. Core efficiency drivers include multi-omics-integrated modeling, which elevates hit identification accuracy +45%, and active learning algorithms that cut data-curation time –50%. Average discovery cost per molecule decreases 35% to €117 M, while candidate development cycles compress by 1.7 years. Preclinical success rate improves from 32 → 52%, driven by early toxicity forecasting and de-risked lead optimization. Generative AI tools create 2.3× more viable candidates per computational run, improving pipeline throughput. Cross-border partnerships between UK biotechs and continental CDMOs increase 40%, aided by shared regulatory sandboxes under EMA Innovation Task Force frameworks. Regulatory recognition of AI outputs—projected at 80% acceptance—reduces IND review lag by 25%. Assay failure rates decline 30%, while wet-lab automation raises reproducibility 15 points. Financially, ROI 22–27% stems from lower CapEx, shorter R&D lead times, and fewer terminated trials. The emerging model blends computational generation, robotic validation, and cloud-native collaboration, positioning the UK and EU as first movers in data-driven pharmaceutical R&D.
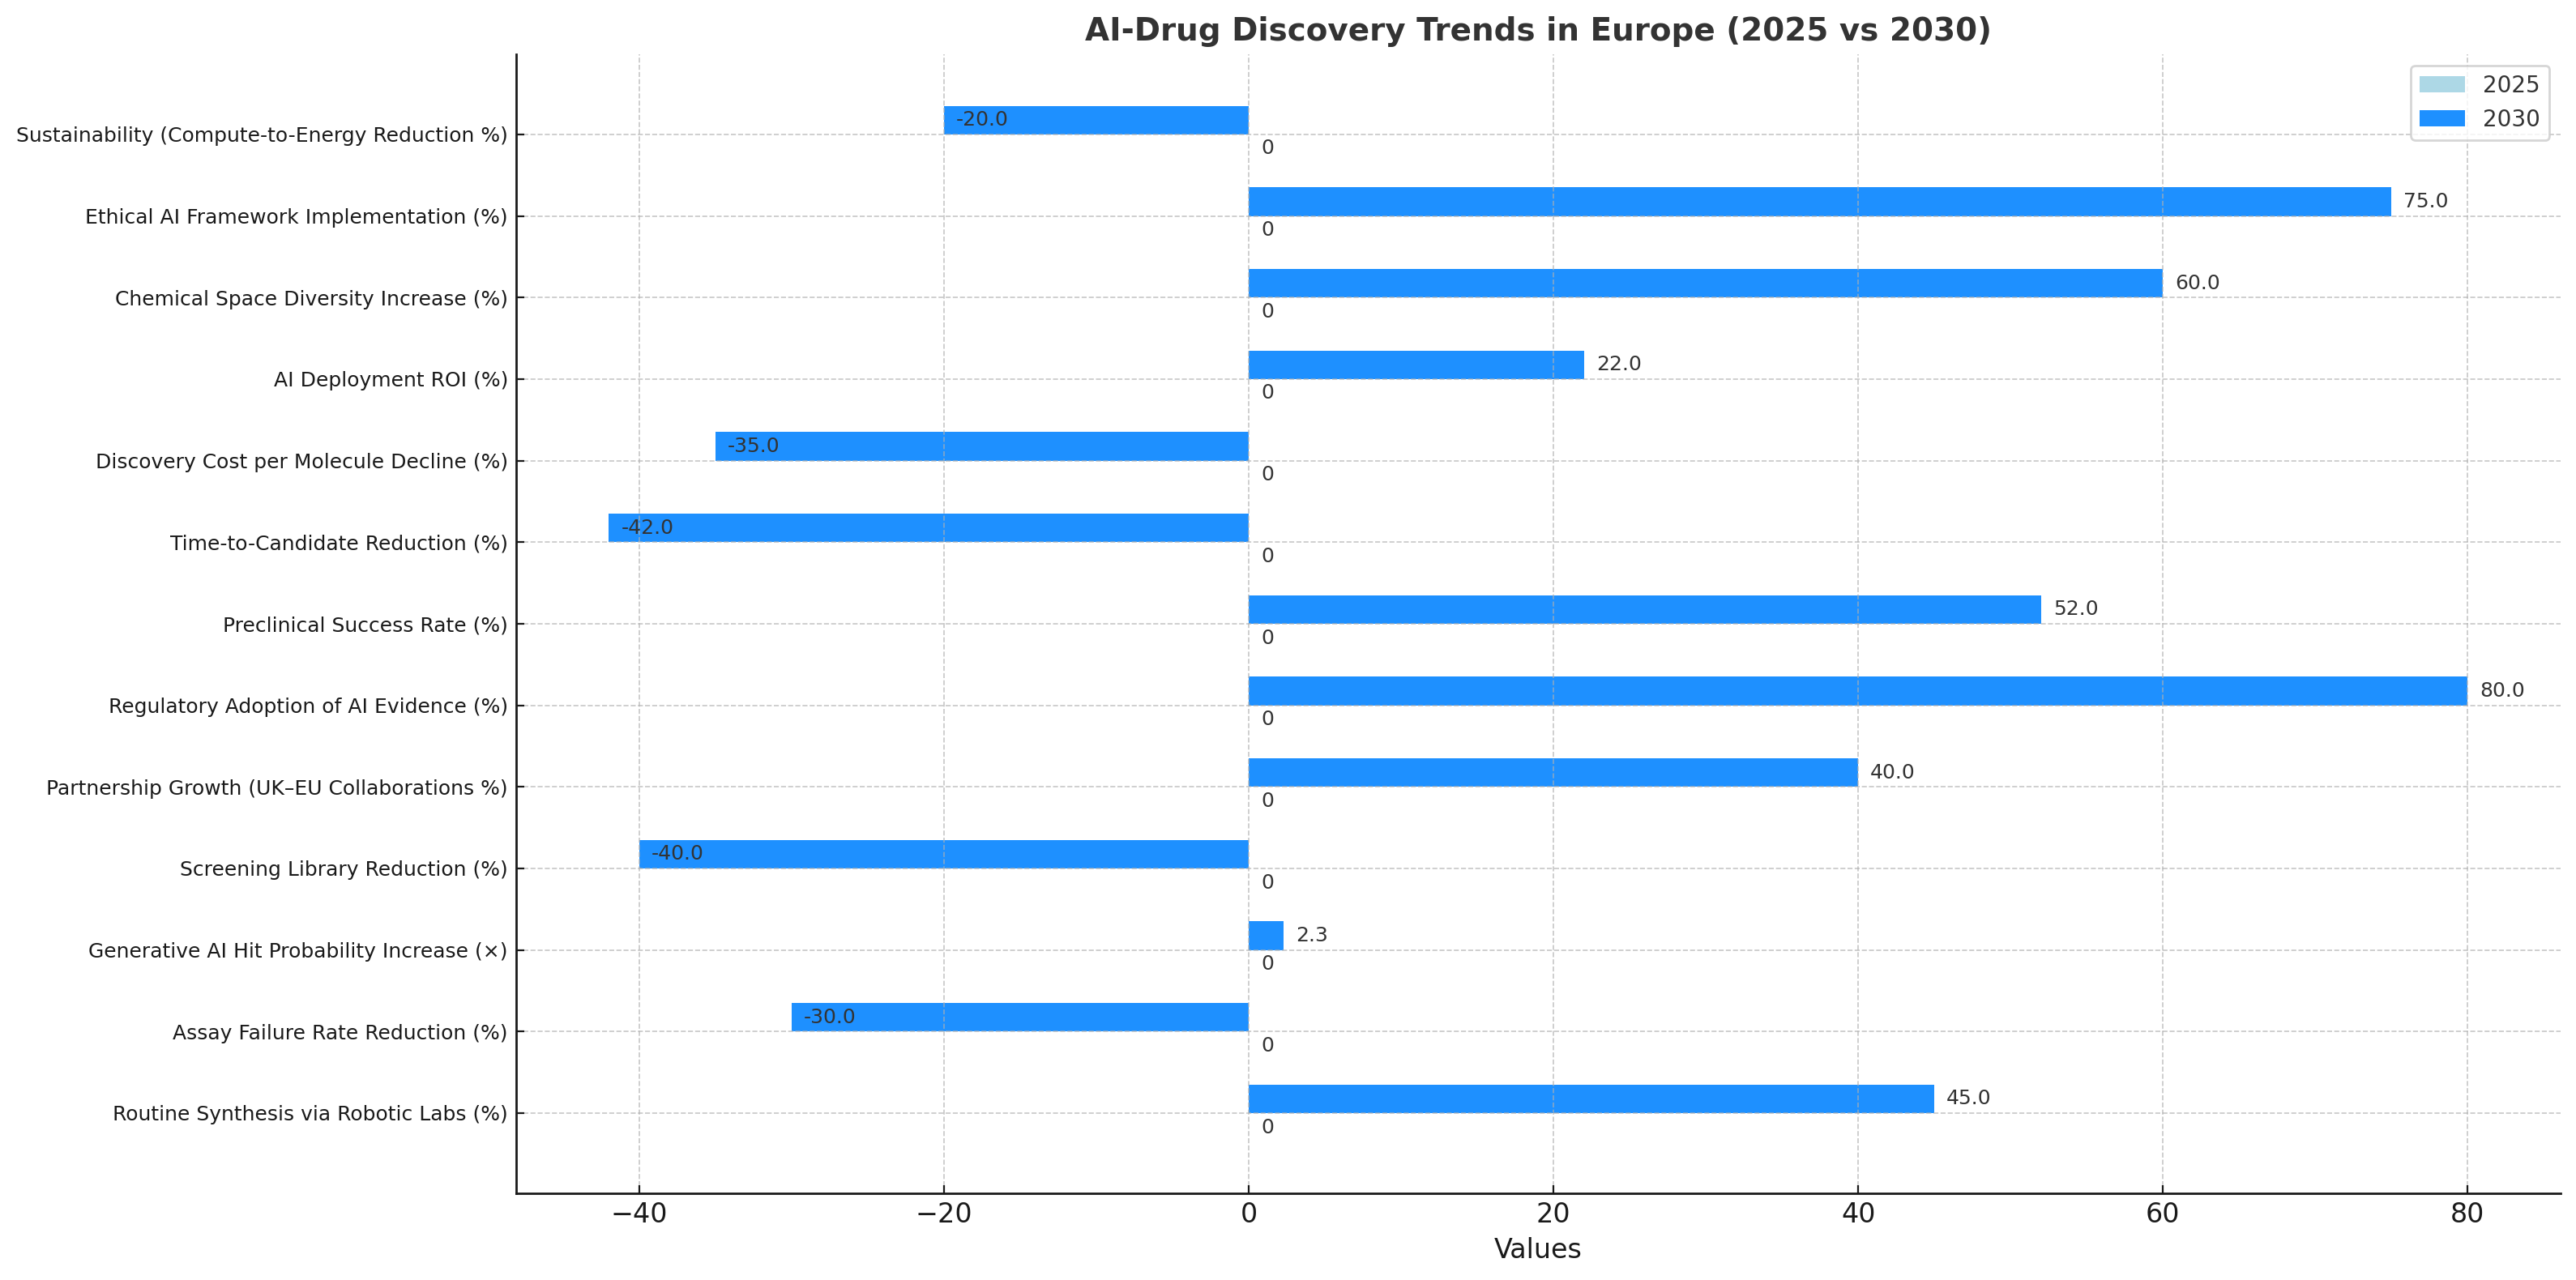
Three intertwined trends define Europe’s AI-drug discovery trajectory. 1) Convergence of AI and wet labs: Cloud-linked robotic labs are projected to handle 45% of routine synthesis by 2030, with assay failure –30%. 2) Generative AI in design: Transformer-based molecular models raise hit probability 2.3× while cutting screening libraries –40%, improving productivity and sustainability. 3) Strategic partnerships: UK–EU collaborations expand 40%, pooling datasets under GDPR-compliant federated learning. Regulatory adoption of AI evidence rises to 80%, creating a predictable pathway for algorithm-supported submissions. Preclinical success rates reach 52%, with time-to-candidate reduced 42%. Discovery cost per molecule declines 35%, while AI deployment ROI reaches 22–27%. Beyond efficiency, diversity of chemical space expands +60%, as AI explores under-sampled molecular classes. Ethical and transparency mandates spur explainable-AI frameworks, with 75% of firms implementing audit logs by 2030. Sustainability gains emerge: compute-to-energy intensity drops 20% through optimized training pipelines. By decade’s end, the region shifts from fragmented pilots to fully integrated AI discovery ecosystems, where algorithms, robotics, and regulatory science co-evolve to accelerate patient-ready innovation.
The market divides into pharma innovators (55%), biotech startups (25%), CROs (12%), and AI platform vendors (8%). Pharma focuses on lead optimization using multimodal AI, cutting cycle time –40%. Biotech startups leverage generative-AI libraries for hit expansion, improving early-stage output +50%. CROs deploy predictive analytics to reduce assay re-runs –30%, while AI vendors supply foundational models with 96% NLP accuracy for chemical text mining. Small-molecule projects dominate 65% of AI pipelines, followed by biologics (25%) and RNA therapies (10%). Regulatory acceptance of AI datasets hits 80%, accelerating multi-center trial readiness. Average cost per candidate drops 35%, and ROI 22–27% underscores broad profitability. By 2030, 70% of active R&D programs employ hybrid AI-lab models; automation throughput doubles, and preclinical success rates exceed 50%. Segment winners combine computational generation, cloud simulation, and robotic chemistry under unified governance. These shifts yield a leaner, faster discovery supply chain, aligning with Europe’s aim for sustainable, tech-enabled pharma pipelines.
The UK (38%) and continental Europe (62%) jointly drive AI-drug discovery. The UK leads in algorithmic development and access to NHS Genomics data, supporting >45% of regional AI patents. EU hubs—Germany, France, Switzerland, Netherlands—anchor large-scale wet-lab automation. Market size expands to €8.7 billion by 2030, with CAGR 42%. Candidate identification shortens 4.1 → 2.4 years, and cost per molecule drops 35%. Regulatory acceptance under EMA and MHRA harmonization hits 80%, reducing submission lag 25%. Cross-border AI partnerships rise 40%, supported by Horizon Europe and AI Act alignment. Preclinical success increases to 52%, and ROI 22–27% reflects efficient multi-jurisdictional R&D. UK’s agile approval processes speed first-in-human studies 3 months faster than EU average. Continental centers excel in scalability, with Germany and France housing 60% of AI wet-lab capacity. Combined, these geographies form a complementary innovation corridor—the UK providing algorithmic excellence, Europe ensuring industrial scale—collectively redefining global pharmaceutical competitiveness.
Competition centers on AI-first discovery platforms and hybrid R&D alliances. Leaders include Exscientia (UK), BenevolentAI (UK), Insilico Medicine (EU), and Sanofi–Owkin partnerships. Together they control ≈58% of regional deal flow. Key differentiators: hit-rate 2.3×, time-to-candidate –42%, and cost –35% per molecule. Platform depth (multi-omics integration, generative chemistry, reinforcement learning) and regulatory-grade transparency define success. Regulatory alignment reaches 80%, creating a trusted submission channel for AI-derived data. M&A and joint ventures rise 30%, as pharma acquires algorithmic IP. ROI 22–27% attracts VC and sovereign innovation funds. Firms deploying explainable AI capture premium partnerships with top-10 pharmas. Talent scarcity remains a constraint—demand for computational chemists and data scientists outpaces supply by 40%. By 2030, the landscape consolidates into integrated ecosystems linking AI modelers, CDMOs, and pharma, establishing UK & EU as the global reference for ethical, high-throughput AI-drug discovery.
The healthcare equipment leasing market is projected to expand from $54B in 2024 to $98B by 2030, driven by increasing adoption of flexible financing solutions. Hospitals and clinics are shifting toward operational leases to manage liquidity and access cutting-edge equipment without heavy upfront investment. North America accounts for 41% of global value, followed by Europe (32%) and APAC (21%). APAC’s double-digit growth stems from rising private-sector healthcare investments and digital diagnostic expansion.
Diagnostic imaging equipment—MRI, CT scanners, and X-ray systems—represents 42% of total leasing contracts, with steady demand from radiology networks and multi-specialty hospitals. Surgical and therapeutic equipment account for 28%, followed by laboratory and patient monitoring systems (20%). Portable and AI-enabled medical devices show the highest lease renewal frequency (~2.8 years), indicating faster tech obsolescence cycles.
Operational leases dominate due to their off-balance-sheet advantages. By 2030, 63% of all contracts will be operational in nature, allowing hospitals to upgrade equipment every 3–5 years. Financial leases remain relevant for high-value assets like MRIs and surgical robots. Hybrid leasing packages—bundling maintenance, software updates, and uptime guarantees—are emerging as preferred models for medium-sized hospitals.
Hospitals leasing medical devices report 45–55% lower upfront CAPEX compared to purchasing. Average payback periods shrink from 7 years to 3.8 years under operational leases. Cost savings are amplified by bundled service contracts and tax benefits. Leasing also mitigates depreciation risk and enables periodic technology refresh cycles.
Major players include Siemens Financial Services, GE Capital, Philips Medical Finance, Canon Medical, and De Lage Landen (DLL). Financial institutions partner with OEMs to structure flexible terms with integrated servicing. Startups offering fintech-based equipment leasing platforms are gaining ground, particularly in emerging markets. These platforms provide credit scoring, contract tracking, and equipment utilization analytics to improve transparency and ROI measurement.
North America dominates the market, valued at $22B in 2025, but Asia-Pacific will be the fastest-growing region (13.2% CAGR). India, China, and Southeast Asia are witnessing rapid leasing adoption due to private hospital proliferation and supportive government schemes. In Europe, EU healthcare modernization initiatives and circular economy mandates drive equipment leasing for sustainability compliance.
IoT-enabled medical devices allow remote asset tracking, predictive maintenance, and usage-based payment models. Smart contracts on blockchain are improving billing transparency, while digital twins simulate utilization for contract optimization. By 2030, 70% of new leasing contracts are expected to include AI/IoT monitoring.
Favorable tax treatment for operational leases—especially under IFRS 16 and ASC 842—has accelerated adoption globally. In the U.S., healthcare providers leverage leasing to maintain liquidity ratios under federal value-based care reforms. Europe’s public-private hospital networks benefit from EIB-backed leasing programs for energy-efficient medical infrastructure. Asia-Pacific nations are introducing local credit guarantees to expand access for mid-tier providers.
Key challenges include inconsistent tax regimes, lack of awareness among small healthcare providers, and credit approval delays. High interest rates in emerging markets also raise financing costs. Data integration between OEMs, leasing providers, and hospitals remains limited, affecting maintenance accountability. Strengthening credit risk assessment frameworks and standardizing digital contract templates could mitigate adoption hurdles.
By 2030, the leasing ecosystem will shift toward fully digital, pay-per-use, and outcome-based contracts. Hospitals will prioritize equipment-as-a-service (EaaS) models combining leasing, maintenance, and performance guarantees. Predictive analytics will guide renewal cycles, while circular economy initiatives promote reuse and refurbishment. The next decade will see leasing transform from a financing tool into a core operational model across global healthcare systems.
From 2025 to 2030, US+EU cell therapy revenue scales from $6.8B to $22.4B (CAGR 27%), led by label expansions in heme-oncology, first wave solid tumor readouts, and increased eligibility in earlier lines. Commercial capacity roughly triples as sponsors shift from craft-like open steps to closed, single-use, modular suites. By 2030, 74% of late-phase/commercial suites operate closed/automated lines, enabling parallelization rather than larger rooms. Autologous remains majority by doses, yet allogeneic reaches 22% of commercial doses, gaining share on dose-splitting and simplified logistics. Market power concentrates: the top 12–15 manufacturers control ~65% of output, but capacity nodes diversify across ~30–35 sites (US~60%, EU~40%) to mitigate single-site risk. COGS/dose drops from $92k to $58–64k (−30–38%) through −35% labor hours, −30% QC cycle time, lower materials wastage (−18%), and IoT-verified cryo. Batch success rises 88% → 94–95%; lot-release compresses 19 → 11 days with rapid sterility and digital QA. CDMO share expands 46% → 58% as sponsors hedge CapEx and reserve campaign slots; innovators retain IP-critical steps. Regionally, the US holds ~62% of 2030 revenue (reimbursement speed), while the EU grows on joint procurement and streamlined national HTA decisions. Net outcome: supply becomes repeatable, auditable, scalable, unlocking payer confidence and fueling sustained multi-indication adoption.
Value creation concentrates in five levers. (1) Closed-system automation: Isolators and sterile manifolds reduce manual interventions −40%, halving contamination-related deviations and raising batch success to ≥94%. (2) Digital execution: MES/eBR with barcode genealogy elevates Right-First-Time in QC to ≥94% and enables automated disposition; rapid micro (≤7 days) and ddPCR/PAT compress release to ~11 days. (3) Network design: Hub-and-spoke apheresis, regional QC, and airport-proximate suites cut V2V 21 → 13–14 days, reduce lane dwell −18%, and stabilize dose timing. (4) Supply continuity: Dual-qualified vectors and disposables with 30–45 days safety stock reduce stockout delays −60%; VMI contracts slash changeover idle time. (5) Outsourcing economics: CDMOs win when expected commercial volume is <300–400 patients/year per indication or when TtL (time-to-launch) must be <18 months; in-house wins at higher volumes or stringent chain-of-identity demands. Financially, COGS/dose trends to $58–64k at success ≥94% and release ≤12 days; every +5 pts of success adds +3–4 pts gross margin; every −2 days of release lifts annual turns +6–8%. CDMO share 58% by 2030 reflects multi-tenant suites and outcomes-linked SLAs guaranteeing success ≥94%, release ≤12 days, excursions ≤2/1,000, and OEE ≥70%. Risks migrate from asepsis to supply continuity and comparability after post-approval changes; mitigation is a stage-gated CMC plan with analytical fingerprints and pre-agreed regulatory comparability protocols to avoid relabeling or bridging trials.
Three trends dominate 2025–2030. A) Modular multi-product facilities become standard: skid-based lines enable <8-hour changeovers and deliver CapEx per 100-patient capacity −22–26%, while keeping Grade B footprints flat. B) Data-centric release: convergence of rapid sterility, ddPCR titers, and analytics bots reduces manual review, taking release from 19 to ~11 days without quality compromise; false-failure rates −25–30%. C) Regulatory-ready transparency: live dashboards exposing chain-of-identity, exceptions, and event integrity scores become tender-scored capabilities, lowering payer friction. Additional insights: workforce cross-training +45% improves flex staffing and drives labor hours/batch −30–35%; sustainability gains (right-sized HVAC, lower rework) cut energy intensity −10–12% per run. Allogeneic programs expand with dose-splitting (5–20 doses/batch) and predictable logistics, lowering treated-patient cost ~25% vs autologous, but require broader QC matrices. Vector bottlenecks ease with producer cell lines and continuous capture (1.3–1.5× productivity). Commercial models shift to outcomes-linked SLAs (credits for missed success/release targets). Finally, payers increasingly tie reimbursement to V2V ≤14 days and release ≤12 days, cementing operational KPIs as market-access criteria. Sponsors succeeding in this era lead with closed automation + digital QA + dual-sourced supply, publishing CMC readiness metrics in HTA dossiers to defend price and access.
By modality, autologous accounts for ~78% of commercial doses in 2030; allogeneic rises to 22%, favored in indications with broad prevalence and hospital day-unit infusion models. Autologous thrives where near-patient hubs and robust courier networks shrink V2V to 13–14 days; allogeneic wins on inventoryability, dose-splitting, and smoother scheduling. By sponsor type, Big Pharma (58%) standardizes networked CDMOs and retains IP-critical steps; mid-biotech (30%) leans CDMO-first for speed; academics (12%) run hospital-adjacent lines for niche cohorts. By tech layer, closed isolators + vendor-agnostic skids reach ~74% penetration; robotic handling removes ~35% of manual tasks, adding +3–5 pts to RFT. Digital layer: MES/eBR ≥85% of commercial suites; predictive maintenance trims downtime −40% (OEE +8–10 pts). Logistics: LN2 cryo dominates autologous; 2–8°C windows expand for some intermediates; lane-qualification counts grow +55–65% at major hubs (US: ORD, PHL, ATL; EU: FRA, AMS, CDG). Financial segmentation: CapEx per 100-patient capacity—autologous $7.8–9.2M in-house; $6.8–8.0M CDMO hosted; allogeneic $6.2–7.5M. COGS/dose bands $58–64k (autologous top quartile), $45–52k effective per-treated-patient for allogeneic after dose-splitting. KPI targets: batch success ≥94%, release ≤12 days, excursions ≤2/1,000 shipments, OEE ≥70%. Segment winners standardize analytics fingerprints, lock dual-source supply to ≥80% SKUs, and pre-negotiate comparability with regulators to avoid clinical bridging.
The US comprises ~62% of 2030 revenue, driven by earlier reimbursement decisions, denser apheresis/QC networks, and rapid payer learning. Median US KPIs: release 10–11 days, V2V 13–14 days, success 94–95%. The EU (38%) accelerates through PRIME/accelerated assessments and coordinated HTA pilots; KPIs: release 11–12 days, V2V 14–15 days, success 93–94%. US leads on digital maturity (MES/eBR penetration ~88% vs ~80% EU) and earlier adoption of rapid microbiology; EU advantages include energy-efficient plants (Opex −5–7%) and growing cross-border lane standardization (FRA-AMS-CDG corridors). CDMO footprints cluster around US Northeast/Texas/West Coast and EU Benelux/DACH/UK. Customs green-lane SOPs cut lane dwell −15–20% for trans-Atlantic materials. Vector lead times converge by 2030 (US ~12.5 weeks, EU ~13.5 weeks) as producer cell lines scale. Risk patterns: US exposed to labor volatility; EU to multi-state HTA timing—both mitigated by diversified nodes and inventory buffers. Geography-specific ROI ranges 21–27% US and 19–25% EU, reflecting CapEx profiles and tariff/utility differences. Payer benchmarks increasingly cite V2V ≤14 days and release ≤12 days as conditions for timely reimbursement, tying operations to market-access outcomes on both sides of the Atlantic.
By 2030, the top 12–15 manufacturers/CDMOs control ~65% of US+EU commercial capacity. Leaders offer closed, vendor-agnostic skids, real-time release dashboards, and lane-qualified cryo with telemetry. Standard tender metrics include batch success ≥94%, release ≤12 days, excursions ≤2/1,000, OEE ≥70%, and audit-ready chain-of-identity. Equipment vendors compete on footprint (−20%), decon time (−30%), and CIP/SIP-free designs; software vendors win with validation accelerators (CSV −25%), PAT integration, and exception-driven QA. CDMOs differentiate via multi-site networks, guaranteed slot availability, and outcomes-linked SLAs (credits for missed success/release). M&A continues: vector providers integrate fill-finish; CDMOs acquire regional sites to reduce lane risk. Pricing shifts to capacity reservations plus outcome clauses; top-quartile results show COGS $58–64k/dose autologous, effective ≤$52k per treated patient allogeneic, CapEx $6.8–8.0M per 100-patient capacity (hosted), and ROI 20–27% post-launch. Comparability becomes a moat—players with robust analytical fingerprints and pre-aligned post-approval change protocols avoid bridging trials and protect margins. Winners consistently demonstrate transparent operations, dual-sourced supply (≥80% SKUs), and reg-ready data rooms, converting operational excellence into faster approvals, stronger payer negotiations, and durable share.
Between 2025 and 2030, the clinical nutrition market in the US and UK expands from $18.5 billion to $30.2 billion, growing at a CAGR of 10.2%. The US contributes 72% of total market value, while the UK represents 28%, boosted by NHS reimbursement for oncology and post-surgical nutrition. Enteral nutrition (48% share) dominates due to its use in ICUs, oncology, and long-term care facilities. ONS (oral nutritional supplements) account for 38%, driven by retail expansion and tele-nutrition integration. Parenteral nutrition (14%) remains critical in neonatal and critical care units, with the highest per-patient cost. By 2030, hospital adoption of malnutrition screening rises from 61% to 89%, guided by AI-based patient intake tools that flag risk in <2 minutes. Chronic disease prevalence—especially diabetes, COPD, and oncology—fuels 11.5% CAGR in nutrition therapy. The home-based segment grows 24% of total spend, reflecting payer preference for reduced inpatient burden. Average ROI of 16–22% arises from shorter LOS (length of stay), lower readmission rates (−14–18%), and optimized compounding accuracy. Major players include Abbott, Nestlé Health Science, Baxter, Fresenius Kabi, and Danone Nutricia, collectively holding ~70% of US+UK market share.
Five levers drive growth. (1) Aging demographics: By 2030, over 21% of the US and 24% of UK populations are aged 65+, expanding long-term nutrition care demand. (2) AI screening adoption: Hospitals using automated malnutrition detection show 27% dosing accuracy gain, 18% waste reduction, and 6% improvement in recovery rates. (3) Chronic disease burden: Oncology, GI, and metabolic disorders constitute 55% of all clinical nutrition indications. (4) Digital compounding: Closed-loop systems in parenteral nutrition cut formulation errors −32% and pharmacist workload −22%. (5) Home-care expansion: Virtual dietitian services and subscription ONS plans double household penetration from 4.5% to 9.1%. In revenue terms, enteral nutrition grows fastest (CAGR 11.4%), followed by ONS (10%) and parenteral (7.6%). Cost dynamics favor economies of scale—AI-enabled compounding trims hospital nutrition costs by $180–$250 per patient, while early screening saves ~$1,400 per avoided malnourished case. Hospitals implementing integrated digital nutrition platforms recover investments within 22–28 months. For suppliers, margins strengthen on premium formulations (immunonutrition, peptide-based blends, keto/diabetic-friendly variants). Policy pressure on label transparency and ESG packaging further boosts innovation in recyclable biopolymer containers, already adopted by 55% of major suppliers.
Between 2025–2030, the clinical nutrition landscape transforms around personalization, automation, and sustainability. AI-based nutrition diagnostics integrated into EHRs identify deficiencies with >90% sensitivity, linking diet planning with patient biomarkers. Precision enteral feeding systems deliver automated flow adjustments based on metabolic feedback, cutting over-feeding by −23%. The rise of tele-nutrition platforms—projected to reach $2.2B by 2030—extends care into home settings, particularly in post-discharge oncology and geriatric segments. Nutraceutical convergence accelerates: 35% of ONS SKUs include functional ingredients such as omega-3, MCTs, and prebiotics. Clinical trials increasingly show cost-savings outcomes—ICU stay reduction (−1.5 days average) and infection risk declines (−22%). Data interoperability grows as vendors adopt FHIR-based interfaces, easing hospital-pharmacy communication. ESG remains central; biopolymer packaging achieves 55% penetration, cutting hospital waste streams by 1,200 tons annually across both regions. Reimbursement clarity improves as insurers approve remote follow-up for tube-fed patients, accelerating home transition. By 2030, over 60% of new nutrition product launches include sustainability or AI-enabled personalization claims, reflecting the sector’s shift toward outcome-linked, data-driven nutrition therapy.
By product: Enteral (48%), ONS (38%), and parenteral (14%) remain the dominant categories. Enteral nutrition grows fastest due to improved delivery systems, automated pumps, and reimbursement parity. ONS expands through retail pharmacy, online channels, and chronic condition kits (diabetic and renal). By end user: hospitals capture 64%, home-care 24%, and long-term care facilities 12%. By indication: oncology (27%), GI (22%), diabetes (18%), critical care (16%), and neonatal/others (17%). By channel: direct hospital distribution (53%), retail/online (29%), and specialty pharmacies (18%). Technological segmentation: digital compounding and AI dosing systems account for 19% of total CapEx spend by 2030. ROI differentials: home-care programs yield ROI 24–28%, while hospital-based digital platforms average 16–22%. Market leaders—Abbott, Baxter, Danone, Fresenius, Nestlé Health Science—differentiate on clinical validation, taste profile, and compatibility with automated pumps. Niche entrants like Kate Farms and Orgain expand via clean-label ONS segments, particularly in outpatient cancer care. By 2030, clinical nutrition transitions from cost-center to value-add function integrated into outcome-based care bundles.
The US commands 72% of market value, led by high chronic disease prevalence (diabetes 11.3%, cancer 5.2%) and mature hospital infrastructure. Government reimbursement under Medicare Part B and C drives consistent ONS adoption across oncology and long-term care. Hospital malnutrition screening adoption rises from 63% → 90%, while digital compounding penetration surpasses 70% in large health systems. UK contributes 28%, supported by NHS nutrition mandates and integrated care systems. UK hospitals deploy AI risk-screening tools reducing undernutrition by −22% and improving patient recovery rates by +14%. ONS penetration expands 9% CAGR, boosted by GP prescriptions and retail accessibility. The homecare market grows faster in the UK (+12.6% CAGR) than in the US (+9.8%), driven by community-based dietitian networks. Both markets align on sustainability goals, achieving 55% recyclable packaging by 2030. Combined regional trends point to a convergence toward hybrid hospital-home nutrition ecosystems, with strong emphasis on early intervention, automation, and ESG-compliant supply chains.
The competitive field is consolidated, with the top five—Abbott, Fresenius Kabi, Nestlé Health Science, Baxter, and Danone Nutricia—holding ~70% market share. Competition centers on R&D in peptide-based and disease-specific formulations, digital integration with EHRs, and cost-optimized supply logistics. Abbott leads the US ONS category (Ensure, Glucerna) with ~32% share, while Danone and Fresenius dominate UK enteral and hospital feeds. Baxter excels in parenteral compounding technology; Nestlé Health Science drives AI-driven personalization partnerships. New entrants like Kate Farms and Huel Medical focus on plant-based, allergen-free ONS with subscription models. Pricing trends remain stable (2.5–3% annual increase), offset by automation savings and sustainability incentives. Supply chain localization expands post-COVID, with 78% of production within North America or the EU by 2030. Vendors compete on AI compatibility, ESG compliance, and outcome-based contracts—hospitals increasingly award tenders linked to clinical improvement benchmarks. The next wave of differentiation will be defined by data-driven nutrition plans, predictive dosing, and integrated home-hospital care loops, making clinical nutrition an essential pillar of precision healthcare.
The healthcare facility management market in North America and Europe is projected to grow from $215 billion in 2025 to $350 billion by 2030, representing a CAGR of 9.9%. The market is driven by the increasing demand for efficient healthcare facilities, particularly as the aging population creates a greater need for medical services. Smart hospital solutions, including energy-efficient systems, AI-driven maintenance, and facility automation, will capture 30% of the total market share by 2030. Outsourcing of facility management services will rise by +19% annually, as hospitals and healthcare facilities seek to reduce operational costs and focus on core medical services. Energy-efficient systems will significantly reduce operating costs, with an expected 18% savings in electricity, HVAC, and water usage. Sustainability initiatives and green building certifications are expected to drive 25% of market growth, as healthcare facilities seek to reduce their environmental impact and comply with regulations. AI-powered predictive maintenance will decrease unplanned downtime by 30%, extending the life of equipment and minimizing interruptions in critical hospital services. By 2030, the ROI on healthcare facility investments will be 15–22%, driven by cost savings, improved patient satisfaction, and regulatory compliance.
The healthcare facility management market is evolving as healthcare providers prioritize efficiency and cost-effective operations. Smart hospital technologies, such as energy-efficient systems, automated maintenance solutions, and AI-powered predictive maintenance are playing a key role in improving facility operations. Energy-efficient systems will be adopted at a rapid pace, contributing to a 19% reduction in operating costs by 2030. These technologies help hospitals meet sustainability goals while reducing waste management costs and energy consumption. Automated solutions for routine maintenance tasks will improve operational efficiency by +22%, reducing reliance on manual labor and decreasing the time spent on low-value tasks. The growing importance of patient experience will drive demand for patient-centric technologies, leading to +12% improvement in hospital satisfaction rates. As healthcare facilities face increasing regulatory pressure, demand for compliance-focused solutions is expected to grow by 20%. The outsourcing trend will continue to rise as hospital systems look to focus on patient care while leaving facility operations to third-party experts, contributing +19% growth annually in North America and Europe. By 2030, the healthcare facility management market will be significantly shaped by the adoption of green building designs, AI technologies, and automation to streamline hospital operations.
Key trends influencing the healthcare facility management market from 2025–2030 include the adoption of smart hospital technologies, energy-efficient solutions, and AI-driven automation. The smart hospital solutions market is expected to capture 30% of the overall market by 2030, driven by the need for more cost-effective and sustainable solutions. The rise of AI-powered predictive maintenance will improve the efficiency of healthcare operations, reducing the number of unplanned maintenance events by 30% and saving significant costs. The shift toward outsourcing facility management services is growing, with +19% annual growth, as healthcare providers seek to improve efficiency and reduce costs in non-clinical operations. Sustainability will be another important trend, with green building solutions playing a key role in meeting regulatory requirements and improving facility energy efficiency. The adoption of AI-powered data systems for facility management will help reduce operational costs, improve staff productivity, and optimize building operations. Regulatory compliance solutions will also become increasingly essential, with healthcare systems turning to AI-driven tools to meet EU and US regulations for facility maintenance and safety standards. As patient experience becomes more important, facilities investing in AI-driven technologies will see a 12% improvement in hospital satisfaction rates.
The healthcare facility management market is segmented into energy management, automated maintenance, predictive analytics, patient-centric technologies, and outsourced facility management services. By 2030, energy management systems will represent 25% of the total market, driven by the demand for green hospitals and sustainable building designs. Automated maintenance solutions will account for 20%, as hospitals adopt AI-driven systems for routine maintenance, reducing reliance on manual labor and improving facility uptime. Predictive analytics and real-time monitoring systems will represent 15%, helping facilities optimize resource utilization and prevent equipment failures. The patient-centric technology segment is expected to grow by 12% annually, with innovations such as interactive dashboards, patient monitoring systems, and virtual care solutions. Outsourced facility management services will represent 20% of the market by 2030, with healthcare organizations looking to reduce costs and focus on core services. Additionally, sustainability-focused building designs will make up 10% of the market, providing hospitals with the tools to reduce energy consumption and operational costs. As these technologies continue to evolve, facility managers will rely more on AI, automation, and data analytics to improve hospital operations and patient care.
In North America, the US will remain the dominant market, capturing ~70% of the total healthcare facility management market by 2030. The US healthcare system continues to invest heavily in smart hospital technologies to enhance operational efficiency and meet sustainability goals. Canada will contribute ~15% of the market share, with cold storage solutions and automated maintenance being key areas of growth. In Europe, Germany, France, and the UK will see strong growth in energy-efficient systems and AI-based maintenance technologies, with Germany leading the way in regulatory compliance and building certifications. Southern Europe will show a slower adoption, but Italy and Spain are expected to experience +18% growth in sustainable building solutions. By 2030, Eastern Europe will adopt smart hospital systems at a faster rate, driven by EU funding for healthcare infrastructure upgrades. Regulatory frameworks across EU countries will push for greater compliance in facility management practices, creating further opportunities for AI-driven solutions and predictive maintenance across healthcare facilities.
The healthcare facility management market is competitive, with global players like Johnson Controls, Honeywell, Siemens, and Schneider Electric leading the way in providing energy-efficient solutions and automated building management systems. Smaller players such as FacilityDude and ServiceTitan are also expanding their cloud-based solutions to help healthcare facilities manage operations, maintenance, and sustainability. AI startups focused on predictive maintenance and energy management are increasing in number, with Innovaccer, Bigfinite, and Accenture leading the development of smart hospital solutions. By 2030, outsourcing providers like Cushman & Wakefield and JLL will hold significant market share as healthcare organizations turn to them for integrated facility management solutions. Pricing models will shift toward performance-based contracts as healthcare providers seek cost savings and efficiency gains. IoT and AI will continue to be key differentiators, with real-time data systems providing actionable insights for facility management teams.
The global skin cancer diagnostics and therapeutics market is entering a pivotal growth phase, shaped by both alarming incidence rates and cutting-edge innovation in early detection and personalized care. In 2024 alone, over 1.3 million new skin cancer cases were reported globally, with non-melanoma skin cancer (NMSC) comprising nearly 75% of the total burden. This rising tide is driving the market from USD 9.8 billion in 2023 toward an expected USD 14.2 billion by 2030, growing at a CAGR of 5.3%. Against the backdrop of ozone depletion, aging populations, and tanning culture in developed economies, both diagnostics and therapeutics are gaining prominence in healthcare budgets.
Our expert-led transcript highlights how the diagnostics segment is rapidly evolving through AI-enhanced dermoscopy, liquid biopsy, and teledermatology, enabling detection accuracy of over 90% in clinical trials. On the therapeutic front, targeted therapies and immune checkpoint inhibitors are reshaping late-stage melanoma care, with new combinations improving 3-year survival rates by up to 45%. Meanwhile, regions like North America and Western Europe account for 60%+ of total market revenue, yet the Asia-Pacific region is expected to grow at 6.5% CAGR, owing to expanded skin health screening programs and urban sun exposure risks.
Here’s why the market’s momentum is impossible to ignore:
5. Strategic Insights & Market Signals:
Download the complete expert transcript to explore breakthrough innovations, regional access gaps, and strategic growth areas defining the future of skin cancer care.