

68 Circular Road, #02-01 049422, Singapore
Revenue Tower, Scbd, Jakarta 12190, Indonesia
4th Floor, Pinnacle Business Park, Andheri East, Mumbai, 400093
Cinnabar Hills, Embassy Golf Links Business Park, Bengaluru, Karnataka 560071


Connect With Us


68 Circular Road, #02-01 049422, Singapore
Revenue Tower, Scbd, Jakarta 12190, Indonesia
4th Floor, Pinnacle Business Park, Andheri East, Mumbai, 400093
Cinnabar Hills, Embassy Golf Links Business Park, Bengaluru, Karnataka 560071
Connect With Us
68 Circular Road, #02-01 049422, Singapore
Revenue Tower, Scbd, Jakarta 12190, Indonesia
4th Floor, Pinnacle Business Park, Andheri East, Mumbai, 400093
Cinnabar Hills, Embassy Golf Links Business Park, Bengaluru, Karnataka 560071
Request Custom Transcript
5G-Enabled Drone Delivery: Cloud Control Systems & Air Traffic Management
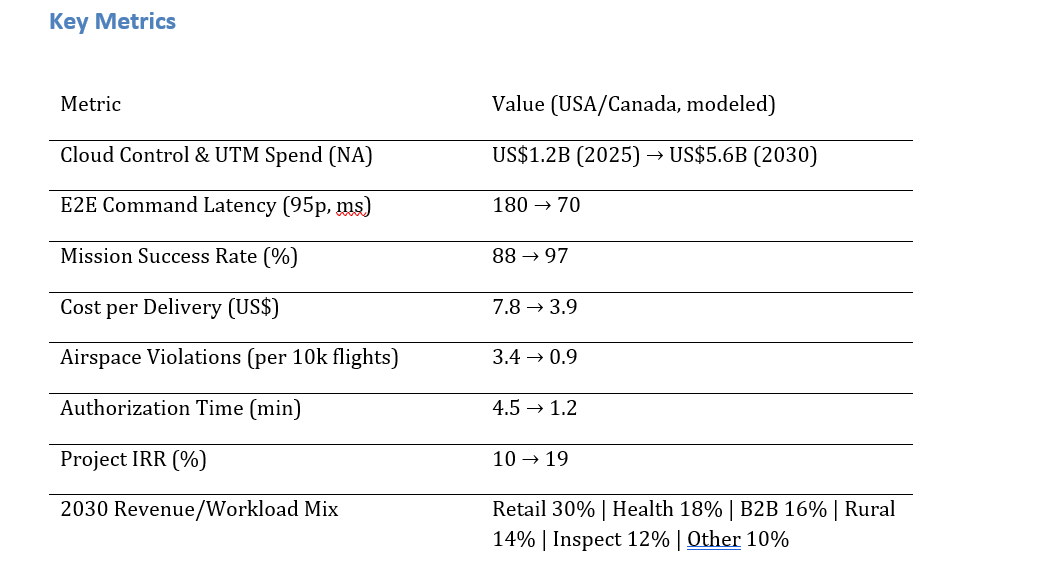
North America is advancing from pilot projects to scaled corridors for drone delivery, powered by 5G, cloud control, and unmanned traffic management (UTM). US-Canada spending on cloud platforms and UTM services is expected to rise from ~$1.2B to ~$5.6B by 2030. Key improvements include reduced command latency, faster authorization, and better airspace compliance. The operating stack includes flight planning, cloud control towers, and UTM orchestration. By 2030, mission success will rise to 97%, delivery costs will halve, and airspace violations will decrease. Pricing includes per-flight fees, per-drone SaaS, and usage fees for priority connectivity. 5G-powered drone delivery will improve logistics efficiency and expand service coverage.
What's Covered?
Report Summary
Key Takeaways
1. 5G with QoS/slicing reduces tail latency for safe BVLOS tele‑operations.
2. Cloud control towers centralize fleet telemetry, handoff, and fail‑safes.
3. Automated UTM compresses authorization cycles and cuts violations.
4. Healthcare and retail corridors anchor utilization and unit economics.
5. Route density and autonomy halve cost per delivery by 2030 (modeled).
6. Redundancy: dual C2 links + local autonomy protect against outages.
7. Compliance posture: remote ID, auditable logs, SBOMs, and incident KPIs.
8. CFO dashboard: latency, success %, cost/delivery, violations/10k, auth time, IRR.
a) Market Size & Share
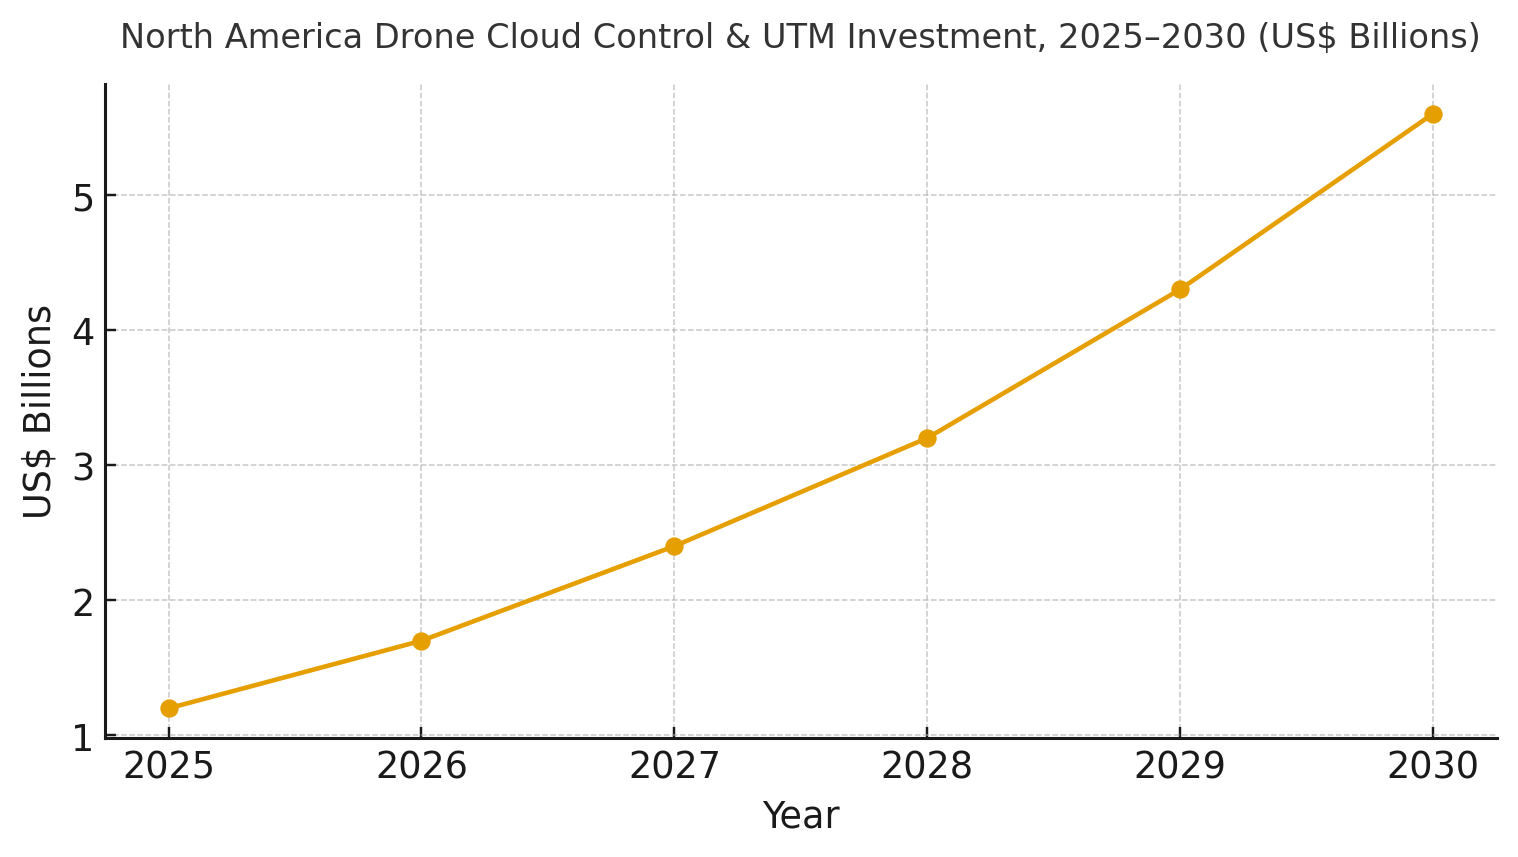
US–Canada spend on drone cloud control and UTM is modeled to rise from ~US$1.2B in 2025 to ~US$5.6B by 2030 as BVLOS operations scale across retail, healthcare, and industrial corridors. The line figure charts the investment ramp. Share accrues to platforms that combine reliable C2 over 5G, automated authorization, and auditable safety tooling. Execution risks: capex phasing, regulatory variance by state/province, and weather volatility. Mitigations: corridor‑first deployments, redundancy and DAA coverage maps, and standardized evidence logs.
b) Market Analysis
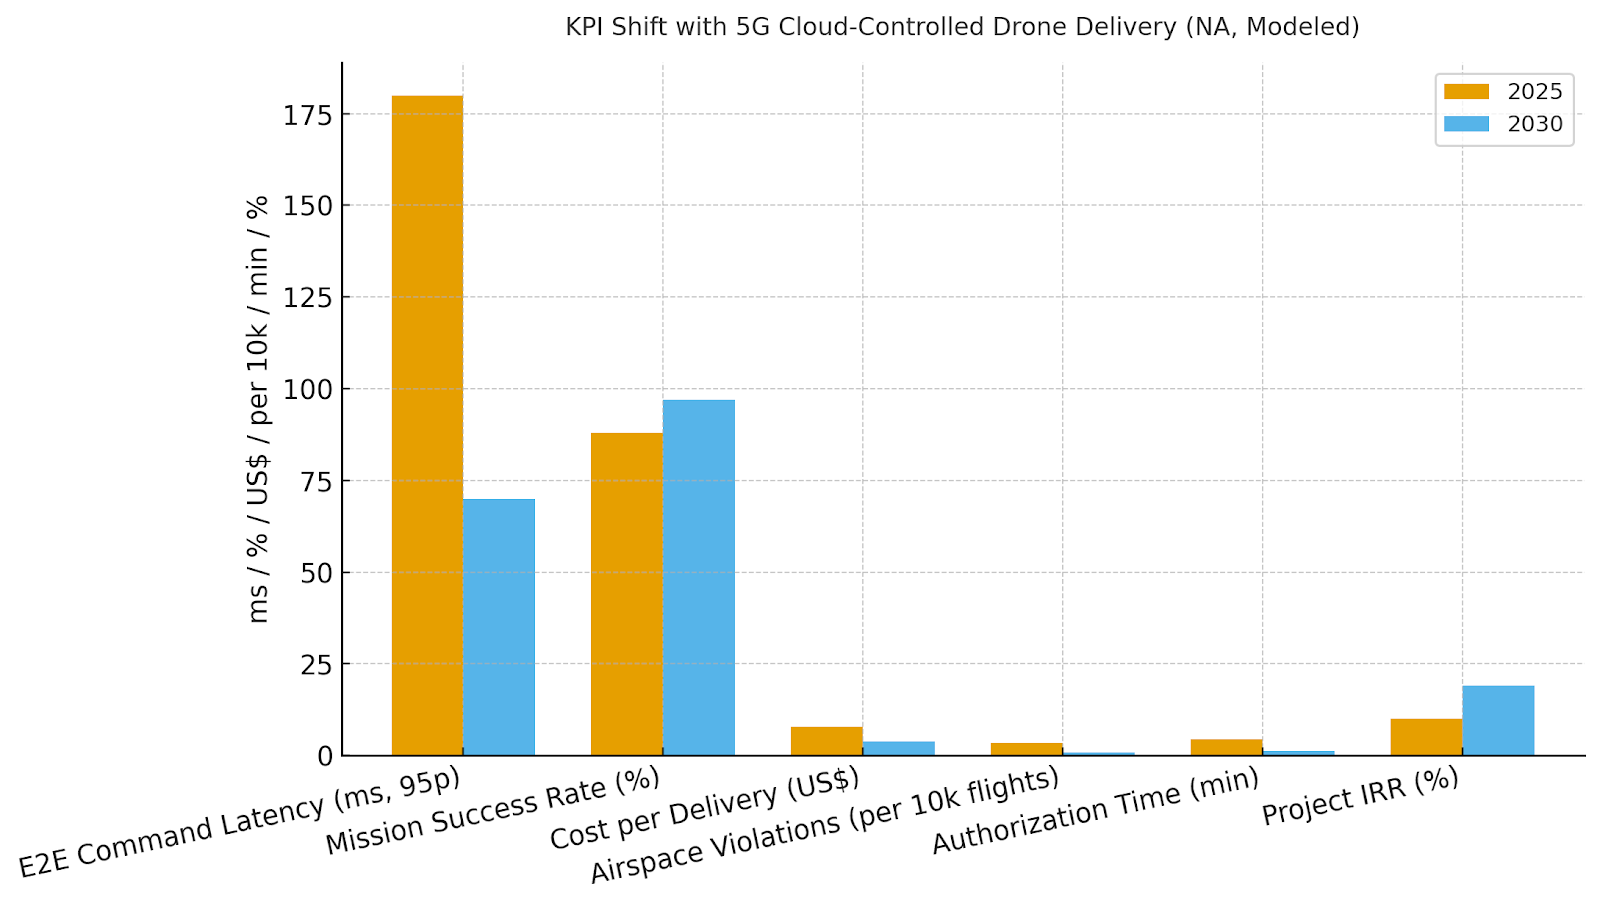
Economics improve with lower latency, higher mission success, and faster authorizations. We model 95p E2E command latency improving from ~180ms to ~70ms through prioritized 5G lanes; mission success rising from ~88% to ~97% via autonomy and DAA; cost per delivery halving from ~US$7.8 to ~US$3.9 with route density and automated dispatch; violations dropping from ~3.4 to ~0.9 per 10k flights; and authorization time compressing from ~4.5 to ~1.2 minutes with UTM automation. Enablers: cloud control towers, QoS/slices, integrated UTM/LAANC, and weather intelligence. Barriers: RF interference, community noise, and ice/heat extremes in specific geographies.
Financial lens: attribute savings vs ground couriers and avoided failed deliveries; add revenue from premium SLAs for healthcare and rural coverage; net against connectivity, software, and CapEx/OpEx for fleets. The bar chart summarizes directional KPI movement under disciplined execution.
c) Trends & Insights
1) Corridor‑first BVLOS unlocks utilization and predictable SLAs. 2) Priority 5G slices emerge for C2 and telemetry with failover paths. 3) Cloud control centers standardize remote pilot handoff and incident response. 4) UTM/LAANC automation reduces manual airspace coordination. 5) Weather intelligence and micro‑forecasts guide dispatch windows. 6) Quiet prop designs and community engagement manage noise acceptance. 7) Healthcare corridors set higher safety and audit bars. 8) Insurers price risk on incident‑per‑10k and compliance logs. 9) Integration with retail OMS/WMS automates pick‑to‑flight. 10) Digital twins simulate routes, density, and risk for planning and regulators.
d) Segment Analysis
Retail Last‑Mile: demand‑dense metro routes; monetize speed premiums; manage noise and landing permissions. Healthcare & Critical: cold chain, specimen runs, and hospital corridors; highest safety and audit demands. B2B Intracampus/Industrial: predictable routes; strong ROI via automation and access control. Rural Logistics & Postal: sparse density but high social value; subsidies and shared corridors improve economics. Infrastructure Inspection: recurring flights; strong UTM value for deconfliction near critical assets. Across segments, define SLAs, safety thresholds, and dispatch logic; track latency, success %, cost/delivery, violations/10k, authorization time, and IRR by segment.
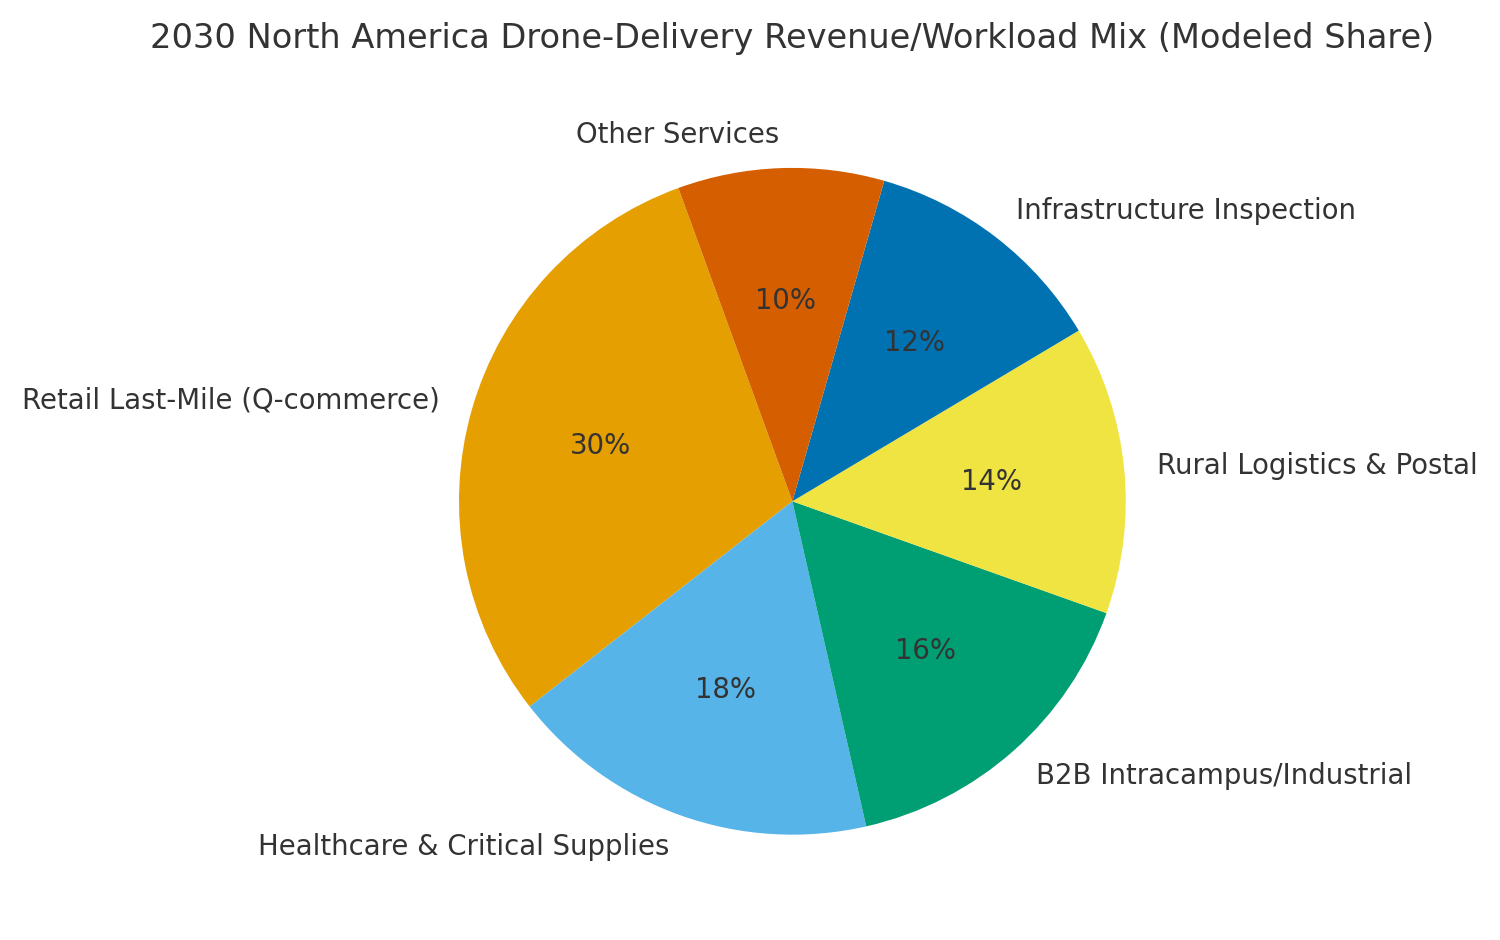
e) Geography Analysis
By 2030, we model North American drone‑delivery revenue/workload mix as Retail Last‑Mile (~30%), Healthcare & Critical (~18%), B2B Intracampus/Industrial (~16%), Rural Logistics & Postal (~14%), Infrastructure Inspection (~12%), and Other (~10%). US metros lead early through retail density and pilot programs; Canadian corridors scale with healthcare and rural coverage. The pie figure reflects the modeled mix.
Execution: align with federal and local regulators; sequence corridors by density and weather windows; and publish transparent safety logs. Measure region‑specific success %, cost/delivery, violations/10k, authorization time, and IRR; reallocate capex and fleet types (multirotor vs fixed‑wing) quarterly.
f) Competitive Landscape
Connectivity providers, UTM vendors, cloud platforms, and drone operators compete to define the North American stack. Differentiation vectors: (1) latency control and coverage with redundancy, (2) UTM automation depth and LAANC integration, (3) cloud control maturity (handoff, fail‑safe, audit), (4) OMS/WMS and healthcare integrations, and (5) community acceptance programs. Procurement guidance: require SLA‑backed latency, incident‑per‑10k, authorization time, and audit immutability; demand open APIs and device attestation; and pilot corridors with clear utilization targets. Competitive KPIs: latency, mission success %, cost/delivery, violations/10k, authorization time, corridor utilization, and IRR.
Report Details
Proceed To Buy
Want a More Customized Experience?
- Request a Customized Transcript: Submit your own questions or specify changes. We’ll conduct a new call with the industry expert, covering both the original and your additional questions. You’ll receive an updated report for a small fee over the standard price.
- Request a Direct Call with the Expert: If you prefer a live conversation, we can facilitate a call between you and the expert. After the call, you’ll get the full recording, a verbatim transcript, and continued platform access to query the content and more.
68 Circular Road, #02-01 049422, Singapore
Revenue Tower, Scbd, Jakarta 12190, Indonesia
4th Floor, Pinnacle Business Park, Andheri East, Mumbai, 400093
Cinnabar Hills, Embassy Golf Links Business Park, Bengaluru, Karnataka 560071
Request Custom Transcript
Related Transcripts

$ 1350

68 Circular Road, #02-01 049422, Singapore
Revenue Tower, Scbd, No.52-53, Jakarta 12190, Indonesia
Cinnabar Hills, Embassy Golf Links Business Park, Bengaluru, Karnataka 560071
4th Floor, Pinnacle Business Park, Andheri East, Mumbai, 400093


68 Circular Road, #02-01 049422, Singapore
Revenue Tower, Scbd, Jakarta 12190, Indonesia
4th Floor, Pinnacle Business Park, Andheri East, Mumbai, 400093
Cinnabar Hills, Embassy Golf Links Business Park, Bengaluru, Karnataka 560071