
68 Circular Road, #02-01 049422, Singapore
Revenue Tower, Scbd, Jakarta 12190, Indonesia
4th Floor, Pinnacle Business Park, Andheri East, Mumbai, 400093
Cinnabar Hills, Embassy Golf Links Business Park, Bengaluru, Karnataka 560071
Connect With Us
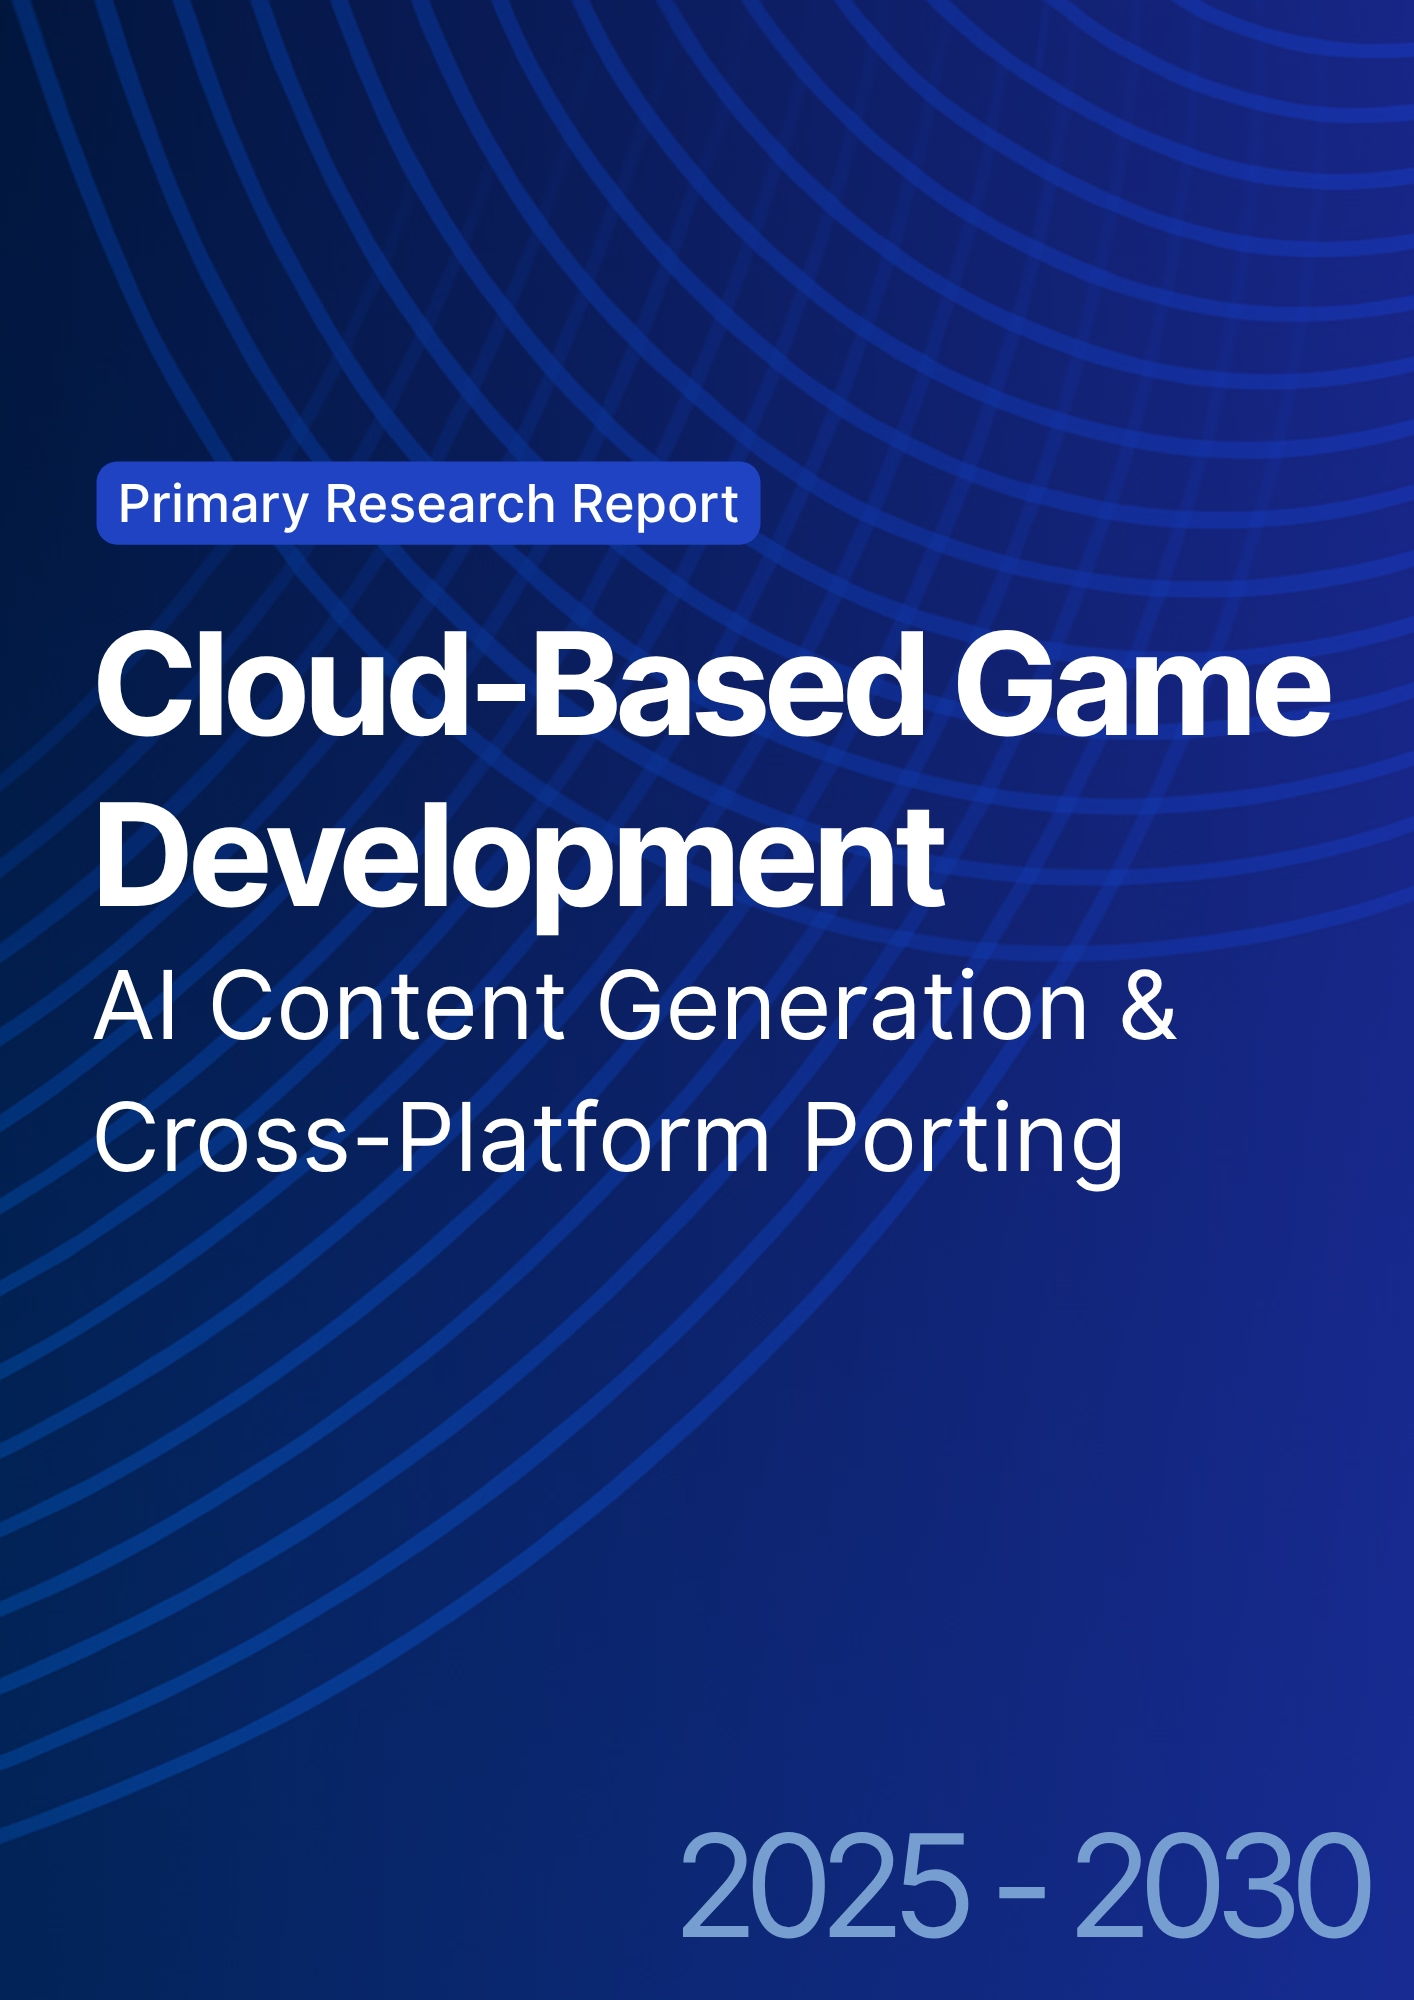
Cloud-Based Game Development: AI Content Generation & Cross-Platform Porting
US studios are moving game production to cloud-based pipelines combining AI-assisted content creation with automated cross-platform deployment. Spending on cloud game development and AI tools is projected to grow from ~$3.8B in 2025 to ~$13.6B by 2030. 3D asset output per artist increases from 22 to 55 assets per month, while content cost per minute drops from $310 to $180. Porting time falls from 18 to 8 weeks, and bug escape rates decline from 4.6% to 2.1%. With containerized CI/CD, procedural generation, and AI pipelines, studios achieve faster releases, higher quality, and 21% IRR by 2030. Cloud-based game development enables scalable, efficient, and reliable production.

What's Covered?
Report Summary
Key Takeaways
1. AI‑assisted pipelines lift artist throughput ~2.5× while lowering unit cost.
2. Porting shrinks to ~8 weeks via containerized farms and API abstraction.
3. Auto‑shader/material translation accelerates multi‑renderer delivery.
4. Generative audio/VO speeds localization for global SKUs.
5. Test generation + coverage analytics halve bug escape rates.
6. CI improvements cut time per build ~45% with caching/incremental compiles.
7. Live‑ops personalization monetizes content faster with A/B frameworks.
8. C‑suite dashboard: throughput, $/min content, port weeks, bug %, CI minutes, IRR.

a) Market Size & Share
US spend on cloud‑based game development platforms is modeled to grow from ~US$3.8B in 2025 to ~US$13.6B by 2030 as AI content generation and cross‑platform tooling consolidate into studio standard stacks. The dual‑axis figure shows spend rising while average port/build cycle time falls from ~18 to ~8 weeks. Share accrues to vendors offering integrated asset pipelines, procedural generation, and compatibility layers spanning consoles, PC, and mobile. Risks: platform policy changes, store compliance shifts, and engine fragmentation; mitigations: abstraction layers, contract tests, and proactive compliance packs. Share tracking should weigh throughput, $/min content, port weeks, bug %, CI minutes, and IRR—not license counts alone.

b) Market Analysis
Our model shows 3D asset throughput rising ~150% as procedural tools and diffusion models scale; content cost per minute declines ~42%; porting time compresses from ~18 to ~8 weeks with containerized farms and API abstraction; bug escape rate halves; and CI minutes per build drop ~45%. Program IRR grows from ~9% to ~21%. Enablers: ML‑ready asset graphs, feature stores for style/rig parameters, and auto‑shader translation. Barriers: artistic consistency, IP provenance risk, and SKU complexity. Financial lens: value is created through faster content cycles, wider platform reach, and reduced rework. The bar figure summarizes KPI shifts under disciplined deployments.
\

c) Trends & Insights
1) Asset provenance graphs track licenses, creators, and dataset lineage. 2) Procedural and diffusion models co‑pilot artists with style locks to maintain IP. 3) Auto‑shader/material translation bridges renderers (DX12, Vulkan, Metal) and solves PBR edge cases. 4) Programmatic porting templates codify input, UI, and store compliance. 5) LLM‑generated test scripts cover flows and edge cases. 6) Synthetic telemetry enables safe A/B for monetization and difficulty. 7) Speech/music generation accelerates localization while preserving tone. 8) Hybrid cloud render farms burst for peak sprints. 9) Plugin marketplaces shift tooling to usage‑based pricing. 10) Explainable AI assists creative direction and compliance reviews.
d) Segment Analysis
AAA/AA: cinematic assets, complex physics, multi‑SKU launches; biggest gains from auto‑shader translation and test generation. Mobile F2P: live‑ops cadence, personalization, and UA creatives; focus on rapid content iteration. Indie: cost‑efficient pipelines and creator tools. Live‑Ops: event generation, A/B frameworks, and dynamic difficulty. Middleware/Tools: portability layers, asset validators, and compliance packs. Across segments, track throughput, $/min content, port weeks, bug %, CI minutes, and IRR; tune targets per SKU complexity and team size.
e) Geography Analysis
By 2030, we model US use‑case spend mix as AI Content (~30%), Porting/Tooling (~24%), Testing & CI (~16%), Live‑Ops Personalization (~14%), Multiplayer/Netcode (~10%), and Marketplaces (~6%). The pie figure reflects this allocation. Adoption clusters around West Coast/Seattle (engine/tooling), Austin/LA (AAA/AA) and Montreal/Austin satellite for North America collaboration. Execution: standardize porting templates, invest in asset provenance, and enforce SLAs for build queues and regression detection.

f) Competitive Landscape
Competition spans engines, cloud providers, asset platforms, and test/CI vendors. Differentiation vectors: (1) integrated asset + porting pipelines, (2) shader/material translation quality, (3) provenance and compliance controls, (4) CI scale and queuing latency, and (5) pricing tied to content/porting outcomes. Procurement guidance: require open APIs, license provenance proofs, build/QA SLAs, and usage‑based cost models with caps. Competitive KPIs: throughput, $/min content, port weeks, bug %, CI minutes, and IRR uplift.
Report Details
Proceed To Buy
Want a More Customized Experience?
- Request a Customized Transcript: Submit your own questions or specify changes. We’ll conduct a new call with the industry expert, covering both the original and your additional questions. You’ll receive an updated report for a small fee over the standard price.
- Request a Direct Call with the Expert: If you prefer a live conversation, we can facilitate a call between you and the expert. After the call, you’ll get the full recording, a verbatim transcript, and continued platform access to query the content and more.


68 Circular Road, #02-01 049422, Singapore
Revenue Tower, Scbd, Jakarta 12190, Indonesia
4th Floor, Pinnacle Business Park, Andheri East, Mumbai, 400093
Cinnabar Hills, Embassy Golf Links Business Park, Bengaluru, Karnataka 560071
Request Custom Transcript
Related Transcripts


68 Circular Road, #02-01 049422, Singapore
Revenue Tower, Scbd, Jakarta 12190, Indonesia
4th Floor, Pinnacle Business Park, Andheri East, Mumbai, 400093
Cinnabar Hills, Embassy Golf Links Business Park, Bengaluru, Karnataka 560071


