

68 Circular Road, #02-01 049422, Singapore
Revenue Tower, Scbd, Jakarta 12190, Indonesia
4th Floor, Pinnacle Business Park, Andheri East, Mumbai, 400093
Cinnabar Hills, Embassy Golf Links Business Park, Bengaluru, Karnataka 560071


Connect With Us


68 Circular Road, #02-01 049422, Singapore
Revenue Tower, Scbd, Jakarta 12190, Indonesia
4th Floor, Pinnacle Business Park, Andheri East, Mumbai, 400093
Cinnabar Hills, Embassy Golf Links Business Park, Bengaluru, Karnataka 560071
Connect With Us
68 Circular Road, #02-01 049422, Singapore
Revenue Tower, Scbd, Jakarta 12190, Indonesia
4th Floor, Pinnacle Business Park, Andheri East, Mumbai, 400093
Cinnabar Hills, Embassy Golf Links Business Park, Bengaluru, Karnataka 560071
Request Custom Transcript
Blockchain-Based Royalty Management: Cloud Platforms for Digital Content
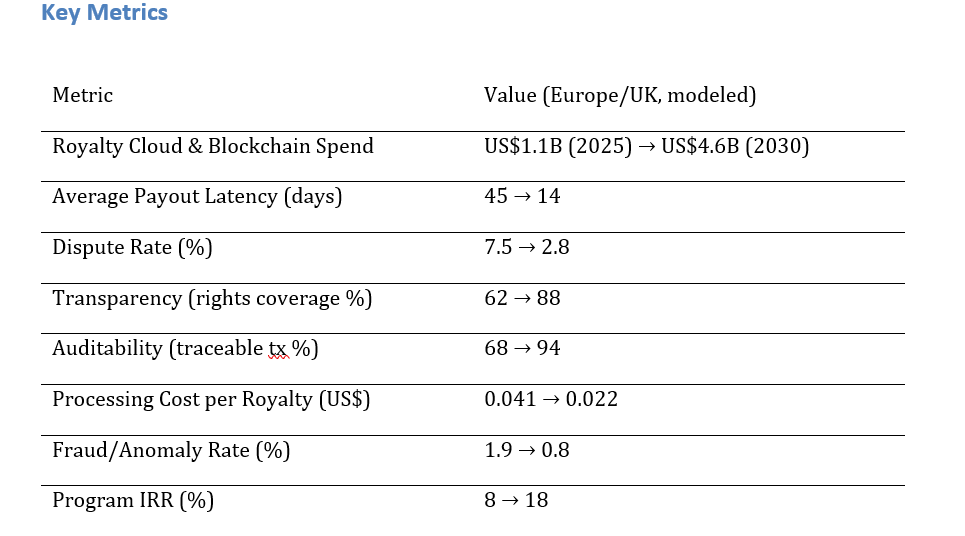
Europe and UK rights holders are upgrading royalty systems with cloud-native ledgers, smart contracts, and analytics to cut payout delays and disputes. Blockchain-enabled royalty spend is projected to grow from ~$1.1B in 2025 to ~$4.6B by 2030, driven by music, OTT, gaming, and publishing platforms adopting standardized IDs. Payout latency drops from 45 to 14 days, dispute rates fall from 7.5% to 2.8%, and auditability rises from 68% to 94%. Processing costs per royalty fall from $0.041 to $0.022. The architecture combines event telemetry, contract engines, and secure payments. Blockchain brings transparency, speed, and trust to Europe’s digital royalty ecosystem.
What's Covered?
Report Summary
Key Takeaways
1. Smart contracts reduce payout latency from ~45 to ~14 days by 2030.
2. Identifier coverage (ISRC/ISWC/ISBN/ISNI) is the #1 driver of dispute reduction.
3. Hybrid ledgers: permissioned settlements with public proofs for auditability.
4. Serverless event processing lowers $/royalty while scaling to burst traffic.
5. Creator portals + APIs increase transparency and trust in split accounting.
6. AML/KYC and eIDAS signatures standardize compliant payouts across the EU/UK.
7. Behavioral scoring and anomaly detection reduce fraud and gaming of streams.
8. C‑suite dashboard: latency days, dispute %, transparency %, audit %, $/royalty, fraud %, IRR.
a) Market Size & Share
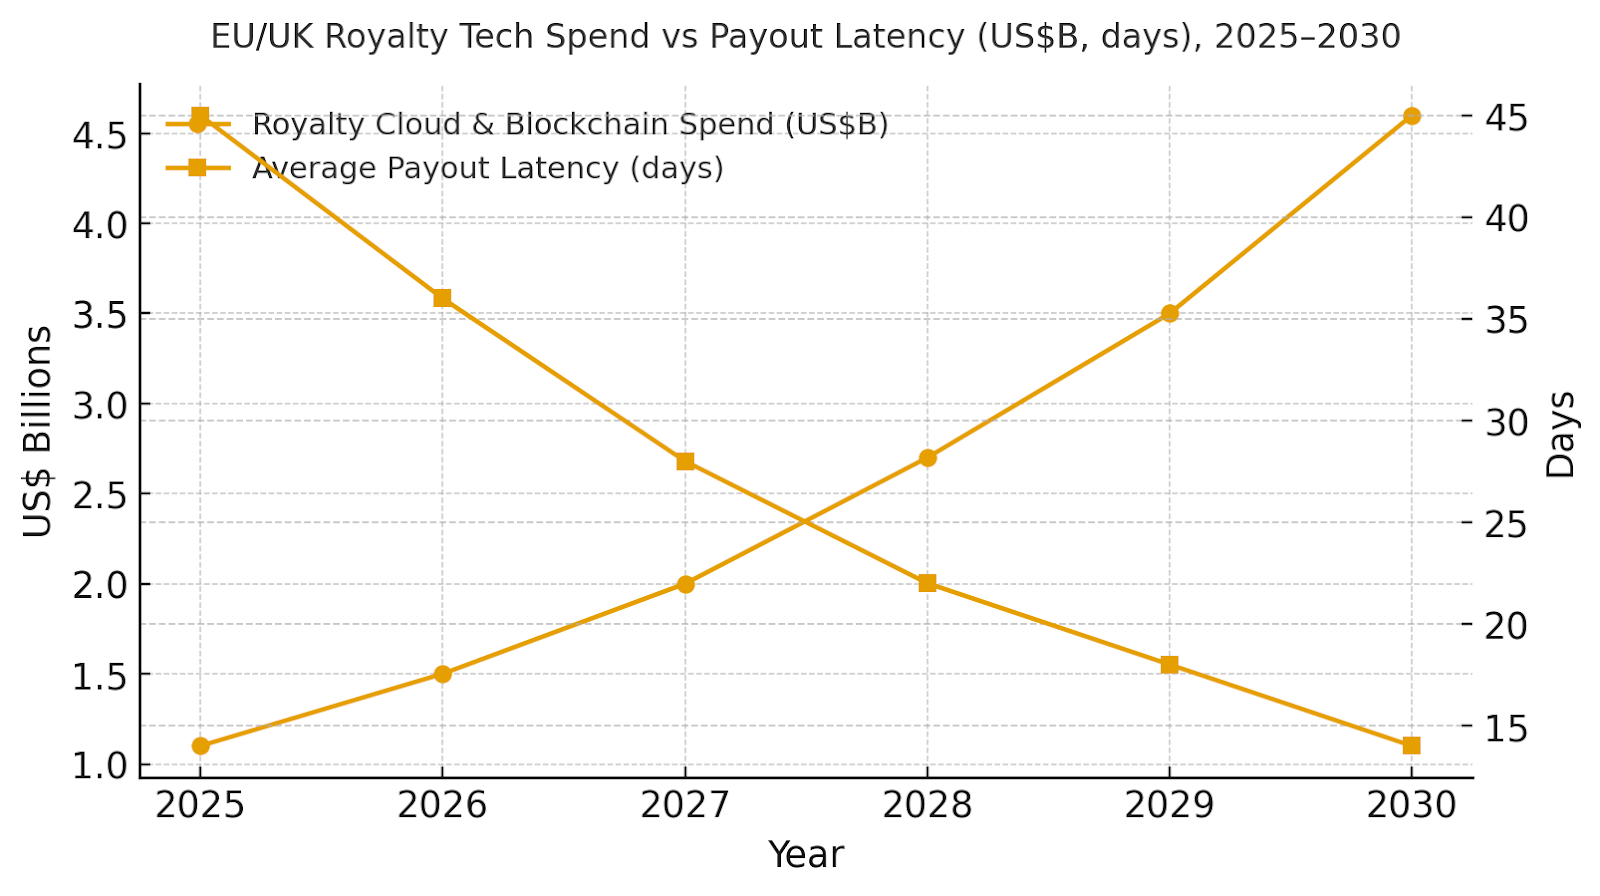
EU/UK royalty technology spend is modeled to grow from ~US$1.1B in 2025 to ~US$4.6B by 2030 as platforms converge on cloud‑based ledgers and standardized telemetry. The dual‑axis figure shows spend growth alongside payout latency falling from ~45 to ~14 days. Share accrues to vendors with (1) strong identifier coverage and repertoire graphs, (2) scalable event pipelines and matching, and (3) hybrid ledger designs with exportable proofs. Execution risks: metadata gaps and complex cross‑border rights; mitigations: catalog remediation, pre‑cleared contract templates, and integration with societies and DSPs. Share should be tracked via latency days, dispute %, transparency %, audit %, $ per royalty, fraud %, and IRR—not revenue alone.
b) Market Analysis
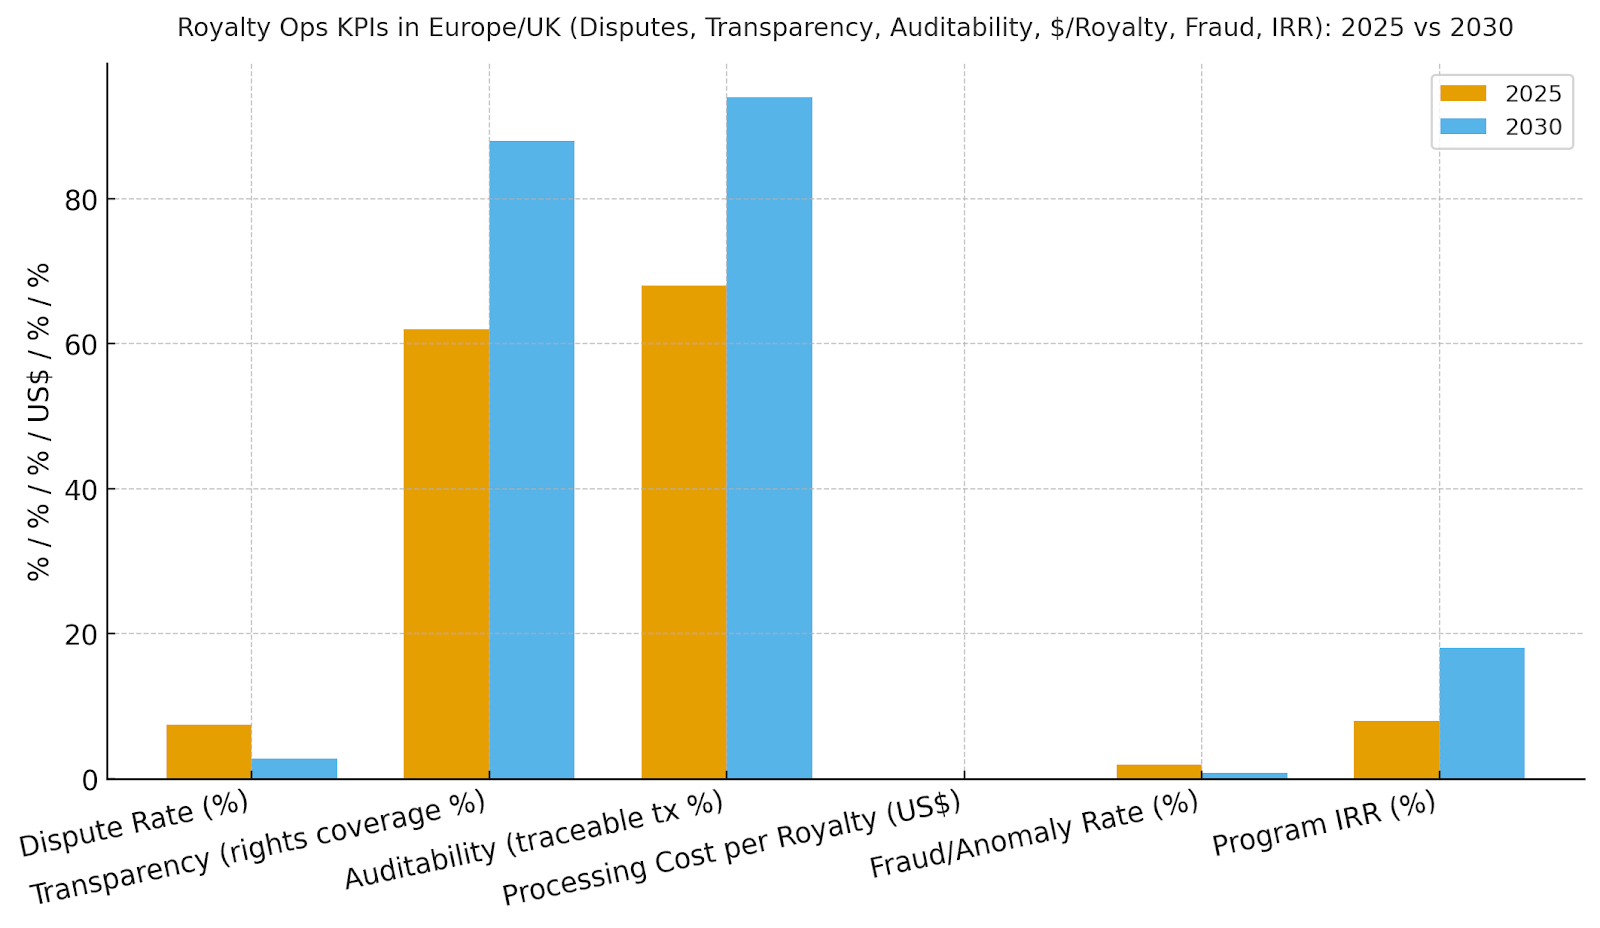
Our model shows disputes falling from ~7.5% to ~2.8% with better ID coverage and matching; transparency expanding to ~88% of catalog; auditability to ~94% with public proofs; processing cost per royalty improving from ~$0.041 to ~$0.022 via serverless and batch optimization; and fraud rate declining to ~0.8% as behavioral scoring matures. IRR grows ~8→~18% with cash‑flow acceleration and fewer write‑backs. Enablers: event streaming, contract engines, and AML/KYC automation. Barriers: heterogeneous rights data and inconsistent reporting formats across DSPs and territories.
Financial lens: value creation comes from faster payouts (lower working capital), dispute avoidance, and reduced back‑office effort. The bar figure summarizes KPI shifts for disciplined programs.
c) Trends & Insights
1) Hybrid ledger architectures balance privacy with public verifiability. 2) Repertoire graphs fuse IDs (ISRC/ISWC/ISNI/ISBN) and contributor roles for conflict resolution. 3) Streaming event analytics detect anomalies (looping, bots) and adjust settlements. 4) Dynamic smart contracts support variable splits and rev‑share floors. 5) Creator portals expose near‑real‑time accruals and statements. 6) Privacy‑preserving proofs enable audits without exposing PII. 7) Cross‑border licensing simplifies via templates and oracles for FX and tax. 8) ESG reporting adds creator payment equity and speed metrics. 9) Open APIs and exportable proofs reduce lock‑in. 10) Outcome‑based pricing aligns vendor comp with latency and dispute reduction targets.
d) Segment Analysis
Music/PROs: high event volume; focus on repertoire coverage, cue sheet resolution, and micro‑payout economics. Video/OTT/FAST: multi‑territory rights and ad‑supported splits; need per‑impression matching. Publishing: complex contributor hierarchies; ISBN/ISNI normalization. Gaming & In‑Game Assets: item licensing and UGC revenue sharing. UGC/Creator Platforms: frequent micro‑payouts with bot/fraud controls. Across segments, track latency days, dispute %, transparency %, audit %, $/royalty, fraud %, and IRR; define SLAs for matching and settlement runs by segment.
e) Geography Analysis
By 2030, we model EU/UK spend/use‑case mix as Music & PROs (~30%), Video/OTT & FAST (~22%), Publishing (~16%), Gaming & In‑Game (~14%), UGC/Creator (~12%), and Licensing/NFT‑adjacent (~6%). The pie figure reflects the mix. UK hubs (London/Manchester) lead adoption for music and creator platforms; major EU territories expand with cross‑border licensing templates. Execution: invest in identifier remediation, integrate with societies/DSPs, and publish audit proofs and latency dashboards.

f) Competitive Landscape
Competition spans cloud providers, royalty platforms, rights societies, and blockchain middleware. Differentiation vectors: (1) identifier coverage and matching precision, (2) smart‑contract flexibility and governance, (3) audit proof exports and regulator‑readiness, (4) AML/KYC payouts and tax handling, and (5) time‑to‑value via templates. Procurement guidance: require open APIs, exportable proofs, latency and dispute SLAs, and cross‑border licensing support. Competitive KPIs: payout latency (days), dispute %, transparency %, audit %, $/royalty, fraud %, and IRR uplift.
Report Details
Proceed To Buy
Want a More Customized Experience?
- Request a Customized Transcript: Submit your own questions or specify changes. We’ll conduct a new call with the industry expert, covering both the original and your additional questions. You’ll receive an updated report for a small fee over the standard price.
- Request a Direct Call with the Expert: If you prefer a live conversation, we can facilitate a call between you and the expert. After the call, you’ll get the full recording, a verbatim transcript, and continued platform access to query the content and more.
68 Circular Road, #02-01 049422, Singapore
Revenue Tower, Scbd, Jakarta 12190, Indonesia
4th Floor, Pinnacle Business Park, Andheri East, Mumbai, 400093
Cinnabar Hills, Embassy Golf Links Business Park, Bengaluru, Karnataka 560071
Request Custom Transcript
Related Transcripts


68 Circular Road, #02-01 049422, Singapore
Revenue Tower, Scbd, No.52-53, Jakarta 12190, Indonesia
Cinnabar Hills, Embassy Golf Links Business Park, Bengaluru, Karnataka 560071
4th Floor, Pinnacle Business Park, Andheri East, Mumbai, 400093


68 Circular Road, #02-01 049422, Singapore
Revenue Tower, Scbd, Jakarta 12190, Indonesia
4th Floor, Pinnacle Business Park, Andheri East, Mumbai, 400093
Cinnabar Hills, Embassy Golf Links Business Park, Bengaluru, Karnataka 560071