

68 Circular Road, #02-01 049422, Singapore
Revenue Tower, Scbd, Jakarta 12190, Indonesia
4th Floor, Pinnacle Business Park, Andheri East, Mumbai, 400093
Cinnabar Hills, Embassy Golf Links Business Park, Bengaluru, Karnataka 560071


Connect With Us


68 Circular Road, #02-01 049422, Singapore
Revenue Tower, Scbd, Jakarta 12190, Indonesia
4th Floor, Pinnacle Business Park, Andheri East, Mumbai, 400093
Cinnabar Hills, Embassy Golf Links Business Park, Bengaluru, Karnataka 560071
Connect With Us
68 Circular Road, #02-01 049422, Singapore
Revenue Tower, Scbd, Jakarta 12190, Indonesia
4th Floor, Pinnacle Business Park, Andheri East, Mumbai, 400093
Cinnabar Hills, Embassy Golf Links Business Park, Bengaluru, Karnataka 560071
Request Custom Transcript
AI-Driven Cloud Cost Governance: Anomaly Detection & Budget Forecasting
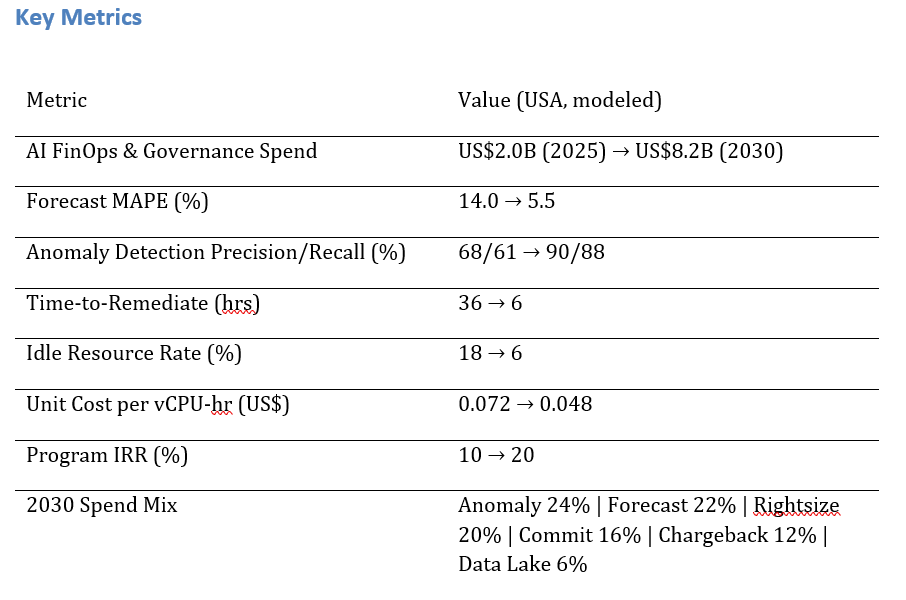
US enterprises are shifting from spreadsheet-driven cost reviews to AI-native FinOps platforms for anomaly detection, budget forecasting, and cost optimization across multi-cloud estates. AI FinOps spend is expected to rise from ~$2.0B in 2025 to ~$8.2B by 2030. Key improvements include better forecast accuracy (MAPE from 14% to 5.5%), higher anomaly detection precision (68/61% to 90/88%), and faster cost spike remediation (36 to 6 hours). Program IRR is projected to improve from ~10% to ~20%. The architecture includes a FinOps data lake, policy-as-code, and automation hooks. Risks like noisy tags and vendor lock-in are mitigated with standardized tagging and multi-cloud commitment management. AI-driven cost governance will align engineering choices with financial outcomes.
What's Covered?
Report Summary
Key Takeaways
1. Forecast error (MAPE) drops to ~5–6% with driver-based feature stores.
2. Context-aware anomalies (precision ~90%, recall ~88%) cut waste quickly.
3. Autonomous rightsizing & scheduling reduce idle capacity to ~6%.
4. Commitment management lifts coverage and lowers unit compute cost.
5. Chargeback & unit economics align engineering with P&L outcomes.
6. Policy-as-code enforces budgets/SLOs with automated guardrails.
7. FinOps data lakes unify CURs, telemetry, and tags for explainable savings.
8. CFO dashboard: MAPE %, precision/recall %, TTR hrs, idle %, unit cost, IRR %.
a) Market Size & Share
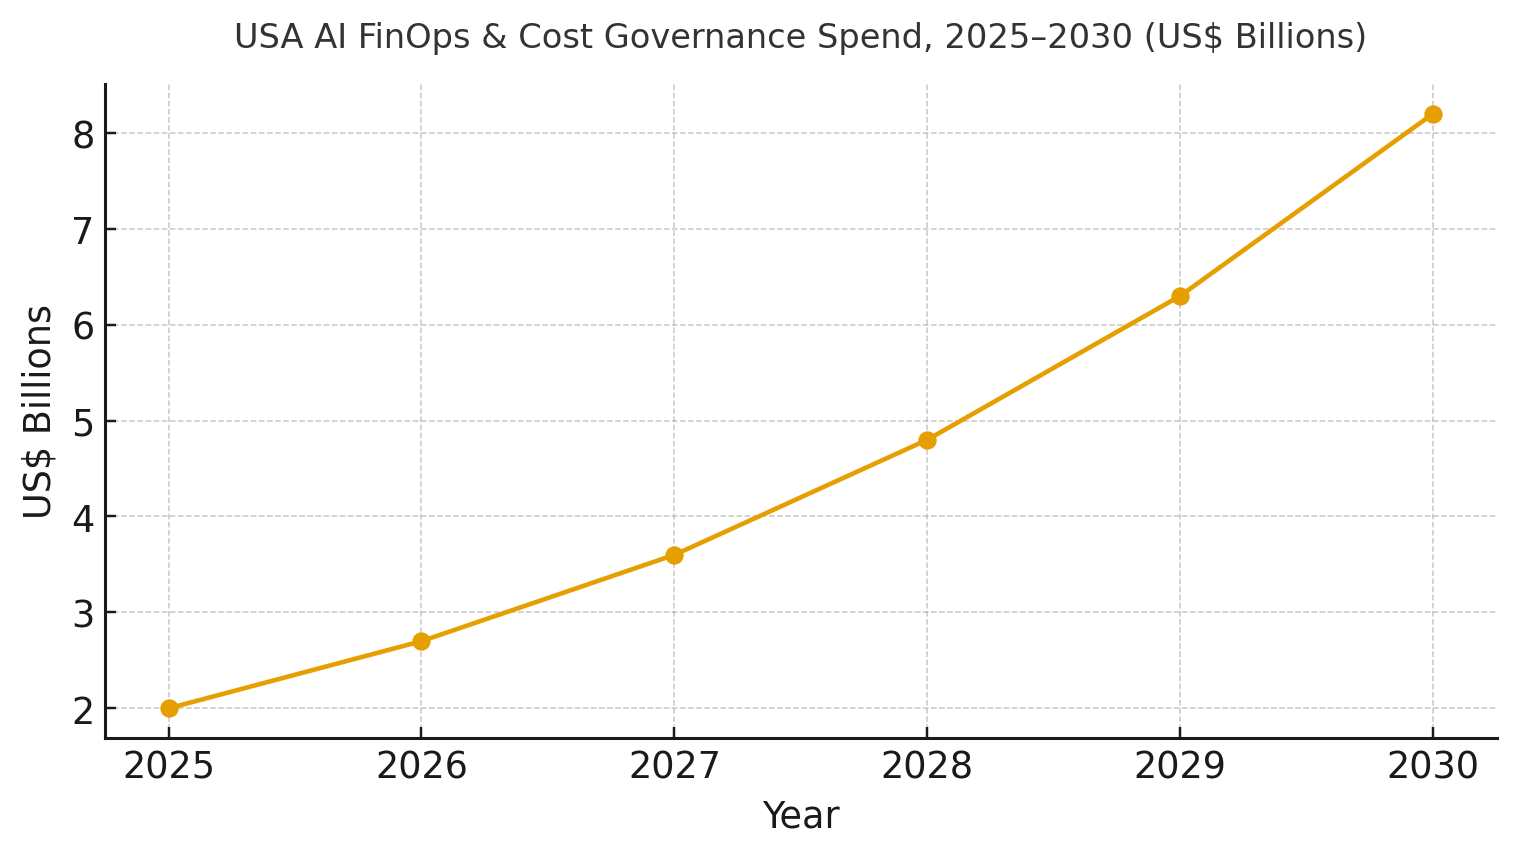
US spend on AI FinOps and cost governance platforms is modeled to rise from ~US$2.0B (2025) to ~US$8.2B (2030) as enterprises adopt anomaly detection, driver-based forecasting, and automated rightsizing at scale. The line figure shows the investment trajectory. Share accrues to vendors that deliver multi-cloud coverage, explainable savings, and closed-loop remediation. Execution risks include tag hygiene, shadow IT, and SKU complexity; mitigations are hierarchical tagging standards, CSP-native ingestion, and commitment simulators that span clouds and terms.
b) Market Analysis
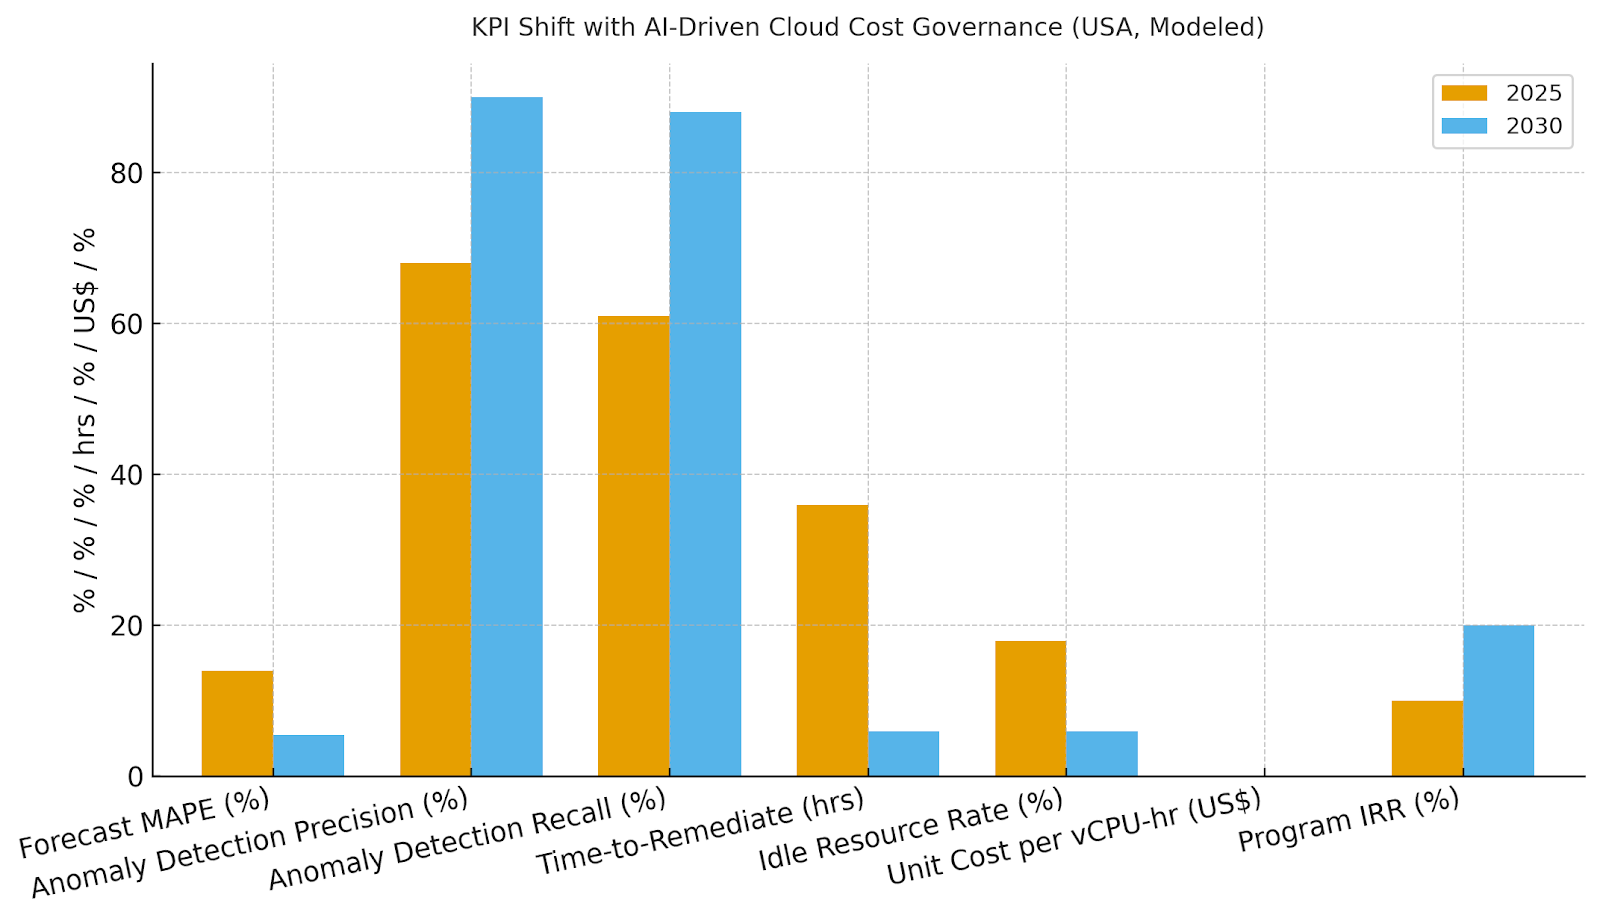
Quantitative improvements drive the business case: forecast MAPE falls from ~14.0% to ~5.5%; anomaly precision/recall improves to ~90/88%; TTR for cost spikes drops from ~36 to ~6 hours; idle resource rate falls from ~18% to ~6%; and unit compute cost declines from ~US$0.072 to ~US$0.048 by 2030. Enablers: driver-based feature stores, graph/context models, policy-as-code guardrails, and automation hooks into orchestrators. Barriers: noisy data, complex pricing catalogs, and organizational friction between platform and product teams.
Financial lens: attribute savings to rightsizing, commitment coverage, and anomaly prevention; add acceleration value from fewer budget freezes; net against tool/license costs and platform work. The bar chart summarizes KPI movement under disciplined programs.
c) Trends & Insights
1) Driver-based forecasting overtakes time-series only models as teams feed real business signals. 2) Context graphs fuse tags, service maps, and metrics to reduce false positives. 3) Automation playbooks remediate safely with rollbacks and guardrails. 4) Unit economics and chargeback become standard; consumption limits are codified. 5) FinOps data lakes unify CURs, telemetry, and purchase commitments with lineage. 6) Cloud vendors expose richer pricing APIs; marketplaces add commitment arbitrage. 7) GPU/AI workloads get specialized rightsizing and queue scheduling. 8) Sustainability joins cost in dashboards (kWh/CO₂ per unit). 9) Synthetic tests validate savings attribution. 10) Procurement buys outcomes (savings SLAs), not just tools.
d) Segment Analysis
Digital-Native SaaS: fastest to adopt autonomous rightsizing; focus on margin expansion. Financial Services: strict budgets and compliance; priority on explainability and rollback safety. Retail/CPG: strong seasonality; driver-based models and anomaly controls around events. Media/Gaming: bursty workloads; commitment hedging and queue-based GPU scheduling. Healthcare/Life Sciences: cost + compliance reporting; fine-grained unit economics. Public Sector: budget ceilings; conservative automation with detailed audit trails. KPIs per segment: MAPE %, precision/recall %, TTR hrs, idle %, unit cost, savings %.
e) Geography Analysis
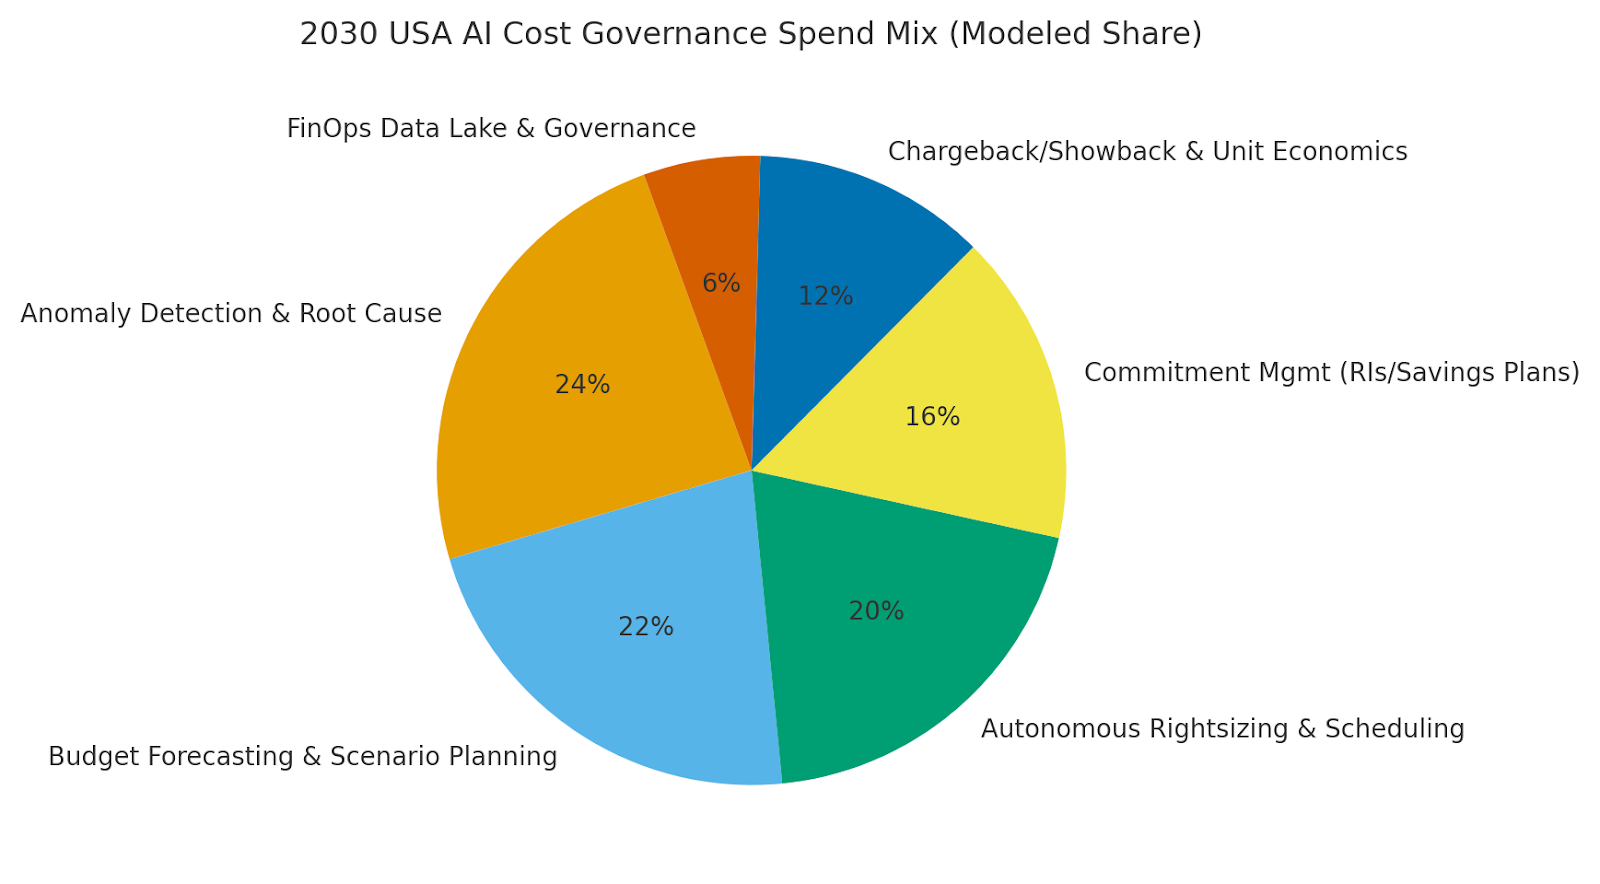
By 2030, we model the USA spend/use-case mix for AI cost governance as: Anomaly Detection & Root Cause (~24%), Budget Forecasting & Scenario Planning (~22%), Autonomous Rightsizing & Scheduling (~20%), Commitment Management (~16%), Chargeback & Unit Economics (~12%), and FinOps Data Lake & Governance (~6%). US coastal tech hubs drive early adoption; central regions scale in retail/CPG and financial services. The pie figure reflects the mix.
Execution: standardize tagging and allocation, align budgets with engineering SLOs, and run quarterly commitment simulations. Measure region- and industry-specific MAPE, precision/recall, TTR, idle %, and unit cost; reallocate commitments and automation scope accordingly.
f) Competitive Landscape
Vendors range from cloud-native FinOps platforms to CSP-native tools and observability suites. Differentiation vectors: (1) driver-based forecasting accuracy, (2) anomaly precision/recall with context graphs, (3) automation depth with safe rollbacks, (4) commitment simulators across multi-cloud, and (5) attribution transparency. Procurement guidance: require open billing/pricing APIs, evidence of KPI lift (MAPE, TTR, idle %, unit cost), and controls for approvals/audit. Competitive KPIs: forecast error, precision/recall, remediation time, idle %, unit cost, and realized savings ROI.
Report Details
Proceed To Buy
Want a More Customized Experience?
- Request a Customized Transcript: Submit your own questions or specify changes. We’ll conduct a new call with the industry expert, covering both the original and your additional questions. You’ll receive an updated report for a small fee over the standard price.
- Request a Direct Call with the Expert: If you prefer a live conversation, we can facilitate a call between you and the expert. After the call, you’ll get the full recording, a verbatim transcript, and continued platform access to query the content and more.
68 Circular Road, #02-01 049422, Singapore
Revenue Tower, Scbd, Jakarta 12190, Indonesia
4th Floor, Pinnacle Business Park, Andheri East, Mumbai, 400093
Cinnabar Hills, Embassy Golf Links Business Park, Bengaluru, Karnataka 560071
Request Custom Transcript
Related Transcripts


68 Circular Road, #02-01 049422, Singapore
Revenue Tower, Scbd, No.52-53, Jakarta 12190, Indonesia
Cinnabar Hills, Embassy Golf Links Business Park, Bengaluru, Karnataka 560071
4th Floor, Pinnacle Business Park, Andheri East, Mumbai, 400093


68 Circular Road, #02-01 049422, Singapore
Revenue Tower, Scbd, Jakarta 12190, Indonesia
4th Floor, Pinnacle Business Park, Andheri East, Mumbai, 400093
Cinnabar Hills, Embassy Golf Links Business Park, Bengaluru, Karnataka 560071