

68 Circular Road, #02-01 049422, Singapore
Revenue Tower, Scbd, Jakarta 12190, Indonesia
4th Floor, Pinnacle Business Park, Andheri East, Mumbai, 400093
Cinnabar Hills, Embassy Golf Links Business Park, Bengaluru, Karnataka 560071


Connect With Us


68 Circular Road, #02-01 049422, Singapore
Revenue Tower, Scbd, Jakarta 12190, Indonesia
4th Floor, Pinnacle Business Park, Andheri East, Mumbai, 400093
Cinnabar Hills, Embassy Golf Links Business Park, Bengaluru, Karnataka 560071
Connect With Us
68 Circular Road, #02-01 049422, Singapore
Revenue Tower, Scbd, Jakarta 12190, Indonesia
4th Floor, Pinnacle Business Park, Andheri East, Mumbai, 400093
Cinnabar Hills, Embassy Golf Links Business Park, Bengaluru, Karnataka 560071
Request Custom Transcript
Video Commerce Revolution in Emerging Markets: Adoption Drivers & Gen-Z Engagement Strategies
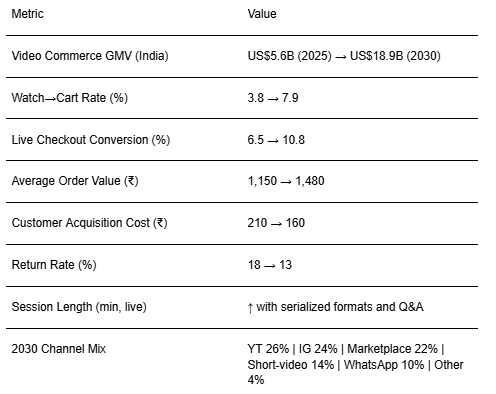
India’s video commerce flywheel is accelerating as content, community, and checkout converge on the same screen. Between 2025 and 2030, we model India’s video‑led gross merchandise value (GMV) expanding from ~US$5.6B to ~US$18.9B, driven by low‑cost data, vernacular creators, and seamless in‑stream checkout. Gen‑Z and young millennials prize authenticity and speed: short‑form demos, live drops, creator storefronts, and peer chat collectively reduce friction compared with traditional PDP funnels. The operating system has four loops. (1) Audience: always‑on short video to seed intent; (2) Live: serialized shows with countdowns, scarcity, and live service; (3) Conversion: native checkout, COD‑aware flows, and instant coupons; (4) Retention: membership perks, post‑purchase content, and service bots. Our modeled KPI shifts: watch→cart rate rises from ~3.8% to ~7.9%; live checkout conversion from ~6.5% to ~10.8%; AOV grows from ~₹1,150 to ~₹1,480 via bundles and limited editions; CAC declines from ~₹210 to ~₹160 on the back of creator whitelisting, first‑party audiences, and marketplaces’ live rails; returns fall from ~18% to ~13% as fit/usage demos and Q&A improve expectation matching.
What's Covered?
Report Summary
Key Takeaways
1. Treat video as a storefront: content → community → checkout in one flow.
2. Serialize live shows; build appointment viewing and drop calendars.
3. Localize: vernacular creators, regional deals, and COD‑aware UX.
4. Bundle SKUs and offer creator‑curated kits to raise AOV and reduce returns.
5. Reduce CAC with whitelisting, first‑party audiences, and marketplace rails.
6. Instrument expectation‑setting with demos, size/fit Q&A, and reviews on‑screen.
7. Use WhatsApp and communities for reorder, service, and retention.
8. CFO dashboard: watch→cart %, live conv %, AOV, CAC, return %, and cohort LTV.
Key Metrics
Market Size & Share
India’s video commerce GMV is modeled to grow from ~US$5.6B in 2025 to ~US$18.9B by 2030. Early share accrues to categories with demonstrable utility (beauty, fashion accessories, home gadgets) and to operators that combine reach (YouTube), curation (Instagram), and logistics trust (marketplaces). The line figure charts the trajectory.
Stack shares: creator acquisition and rights, live production and studios, shoppable video tech, payments/COD risk, and last‑mile SLAs. Execution risks: platform policy shifts, COD‑related RTO spikes, and creative fatigue. Mitigations: diversify channels, address scoring and partial prepay, serialized formats with clear value, and promise‑date discipline. Share should be tracked via GMV by channel, watch→cart %, live conversion %, AOV, CAC, and returns.

Market Analysis
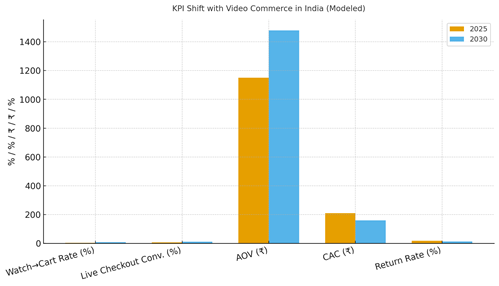
Funnel efficiency and trust drive economics. We model watch→cart rising from ~3.8% to ~7.9% as short‑form aims for clearer product hooks; live checkout conversion from ~6.5% to ~10.8% as native checkout, instant offers, and community chat compress friction; AOV from ~₹1,150 to ~₹1,480 via creator kits and bundles; CAC falling from ~₹210 to ~₹160 through first‑party audiences and marketplace live rails; and returns improving from ~18% to ~13% as demos align expectations. Enablers: vernacular creators, on‑screen Q&A, creator CRM, and COD risk controls. Barriers: logistics slips post‑drop, content fatigue, and inconsistent attribution across channels.
Financial lens: read incremental sales and margin net of rev‑share and platform fees; enforce COD gates based on address/RTO scores; and run geo/HH holdouts to isolate true lift. The bar chart summarizes directional KPI movement under disciplined execution.
Trends & Insights
1) Serialized live formats (weekly shows) create habit and lower CAC. 2) Vernacular commerce expands TAM—creators in Hindi, Tamil, Telugu, Bengali, and Marathi unlock regional cohorts. 3) Creator kits and limited drops raise AOV and reduce returns by bundling complements. 4) Community chat and on‑screen reviews build trust in low‑touch categories. 5) COD‑aware design (partial prepay, address scoring) cuts RTO losses. 6) Marketplace live rails converge with D2C identity to retain customers beyond platforms. 7) AI editing and templated studios compress time‑to‑content. 8) Brand safety and disclosure rules protect accounts and long‑term reach. 9) WhatsApp clienteling turns one‑time buyers into members. 10) MMM and holdouts calibrate multi‑channel budgets.
Segment Analysis
Beauty & Personal Care: Demo‑heavy, strong live conversion; returns drop with shade guidance. Fashion & Accessories: Sizing charts and try‑on help; bundles lift AOV. Home & Kitchen: Utility demos and before/after; high watch→cart. Electronics/Gadgets: Spec clarity, warranty and COD gating; manage returns via expectation setting. Grocery/Snacks: Limited‑time deals and creator tasting; low AOV but high frequency. Across segments, define creator tiers, drop cadence, risk controls, and service SLAs; track watch→cart %, live conv %, AOV, CAC, and returns by category.
Geography Analysis
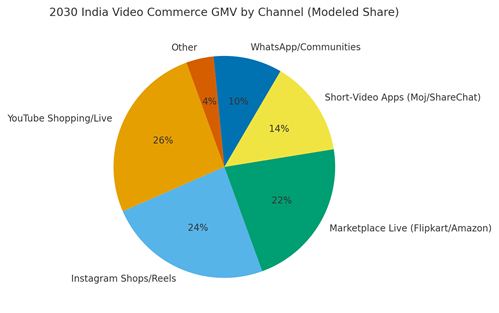
By 2030, India’s channel mix for video commerce GMV is modeled as YouTube Shopping/Live (~26%), Instagram Shops/Reels (~24%), Marketplace Live (Flipkart/Amazon, ~22%), Short‑video apps such as Moj/ShareChat (~14%), WhatsApp/Communities (~10%), and Others (~4%). Metro‑tier cities lead early with creator density and logistics; tier‑2/3 growth follows via vernacular creators and marketplace rails. The pie figure reflects the modeled channel mix.
Execution: stage rollouts by state and language; anchor logistics partners by region; and tune COD rules by RTO hotspots. Measure geography‑specific watch→cart %, live conversion %, AOV, CAC, return %, and repeat purchase; reallocate creator budgets quarterly.
Competitive Landscape
Platforms compete on native checkout, creator tools, and trust rails; brands compete on serialized formats, service SLAs, and community building. Differentiation vectors: (1) creator ecosystem and vernacular depth, (2) native checkout and COD risk controls, (3) logistics reliability and promise‑date discipline, (4) attribution and first‑party identity, and (5) moderation and brand safety. Procurement guidance: require SKU‑level attribution, API access to order events, and COD/RTO scoring; negotiate rev‑share and traffic guarantees tied to creator shows. Competitive KPIs: watch→cart %, live conversion %, AOV, CAC, return %, and cohort LTV.
Report Details
Proceed To Buy
Want a More Customized Experience?
- Request a Customized Transcript: Submit your own questions or specify changes. We’ll conduct a new call with the industry expert, covering both the original and your additional questions. You’ll receive an updated report for a small fee over the standard price.
- Request a Direct Call with the Expert: If you prefer a live conversation, we can facilitate a call between you and the expert. After the call, you’ll get the full recording, a verbatim transcript, and continued platform access to query the content and more.
68 Circular Road, #02-01 049422, Singapore
Revenue Tower, Scbd, Jakarta 12190, Indonesia
4th Floor, Pinnacle Business Park, Andheri East, Mumbai, 400093
Cinnabar Hills, Embassy Golf Links Business Park, Bengaluru, Karnataka 560071
Request Custom Transcript
Related Transcripts

$ 1395


68 Circular Road, #02-01 049422, Singapore
Revenue Tower, Scbd, No.52-53, Jakarta 12190, Indonesia
Cinnabar Hills, Embassy Golf Links Business Park, Bengaluru, Karnataka 560071
4th Floor, Pinnacle Business Park, Andheri East, Mumbai, 400093


68 Circular Road, #02-01 049422, Singapore
Revenue Tower, Scbd, Jakarta 12190, Indonesia
4th Floor, Pinnacle Business Park, Andheri East, Mumbai, 400093
Cinnabar Hills, Embassy Golf Links Business Park, Bengaluru, Karnataka 560071