

68 Circular Road, #02-01 049422, Singapore
Revenue Tower, Scbd, Jakarta 12190, Indonesia
4th Floor, Pinnacle Business Park, Andheri East, Mumbai, 400093
Cinnabar Hills, Embassy Golf Links Business Park, Bengaluru, Karnataka 560071


Connect With Us


68 Circular Road, #02-01 049422, Singapore
Revenue Tower, Scbd, Jakarta 12190, Indonesia
4th Floor, Pinnacle Business Park, Andheri East, Mumbai, 400093
Cinnabar Hills, Embassy Golf Links Business Park, Bengaluru, Karnataka 560071
Connect With Us
68 Circular Road, #02-01 049422, Singapore
Revenue Tower, Scbd, Jakarta 12190, Indonesia
4th Floor, Pinnacle Business Park, Andheri East, Mumbai, 400093
Cinnabar Hills, Embassy Golf Links Business Park, Bengaluru, Karnataka 560071
Request Custom Transcript
Sustainable Packaging Innovation in CPG: Cost-Benefit Analysis & Consumer Perception Shifts
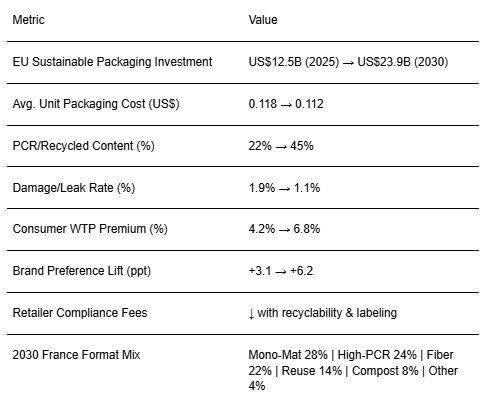
Sustainable packaging is moving from CSR line‑item to margin‑relevant design in European CPG, with France adopting faster under regulatory and retailer pressure. From 2025 to 2030, we model EU investment in sustainable packaging rising from ~US$12.5B to ~US$23.9B as brands migrate to recyclable mono‑materials, high‑PCR plastics, and fiber‑based formats, while piloting reusable/refill and compostable lines. The business case blends cost control, retailer compliance fees, damage reduction, and consumer preference lift especially among Gen‑Z and affluent urban cohorts. Unit economics: short‑term material premiums narrow as PCR supply scales and design‑for‑recyclability reduces components, adhesives, and inks. Our model suggests unit packaging cost edging down from ~US$0.118 to ~US$0.112 by 2030 through bill‑of‑materials simplification and transport savings (lower DIM weight). Quality improves damage/leak rate drops from ~1.9% to ~1.1% reducing refunds and reverse‑logistics cost.

What's Covered?
Report Summary
Key Takeaways
1. Design‑for‑recyclability simplifies BOM and lowers cost by 2030.
2. Higher PCR and fiber shift reduce damage and reverse‑logistics cost.
3. Verified claims (QR/serialization) raise WTP and preference among EU consumers.
4. Eco‑modulation and retailer scorecards make compliance margin‑relevant.
5. Barrier performance must be tuned coatings vs multilayers trade‑offs.
6. Refill/reuse works in urban formats; require deposit and durable packs.
7. Supply resilience: multi‑source PCR/fiber; standardize specs across plants.
8. CFO dashboard: unit cost, PCR %, damage %, WTP %, preference lift, and fees avoided.
Key Metrics
Market Size & Share
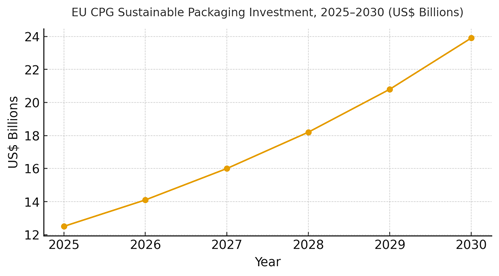
EU CPG sustainable packaging investment is modeled to grow from ~US$12.5B in 2025 to ~US$23.9B in 2030 as brands and retailers converge on simpler, recyclable designs with higher PCR content. France scales early due to retailer requirements and eco‑modulation incentives. The line figure shows the trajectory.
Share accrues to suppliers and brands that standardize mono‑material families, certify PCR sources, and integrate on‑pack identities (QR/NFC) for claim verification and sorting guidance. Execution risks: PCR volatility, coating compatibility with recycling streams, and plant changeover constraints; mitigations include contracting buffers, spec libraries, and pilot‑to‑plant playbooks. Share should be tracked via PCR % by SKU, unit cost, damage %, and compliance fee reductions.
Market Analysis
Unit economics improve as designs simplify and PCR markets deepen. We model average unit packaging cost edging down from ~US$0.118 to ~US$0.112; PCR content rising from ~22% to ~45%; damage/leak rate falling from ~1.9% to ~1.1%; consumer WTP premium rising from ~4.2% to ~6.8%; and brand preference lift moving from ~+3.1 to ~+6.2 ppt by 2030. Enablers: spec libraries (mono‑material, easy‑peel, water‑soluble inks), QR‑based verification, and right‑sized packs that lower DIM weight. Barriers: coating/barrier trade‑offs, PCR color/odor variability, and capex for line conversions.
Financial lens: attribute savings from reduced damage, reverse‑logistics, and compliance fees; add price realization from WTP and preference lift; net against material premiums and capex depreciation. The bar chart summarizes directional KPI shifts under disciplined sustainable‑packaging programs.

Trends & Insights
1) Design‑for‑recyclability beats complex multi‑layers: mono‑PE/PP, clear PET, and fiber‑first trays. 2) On‑pack identities (QR/NFC) verify claims, guide sorting, and unlock loyalty and recalls. 3) PCR markets mature with contracts and color control; food‑grade streams expand. 4) Refill/reuse scales in urban niches beauty/homecare where durable packs amortize. 5) Eco‑modulation and retailer scorecards standardize specs and labels. 6) Security inks and anti‑tamper features deter counterfeits in premium CPG. 7) Life‑cycle labels and third‑party audits reduce greenwashing risk. 8) Automation‑friendly packaging reduces line downtime. 9) Right‑sizing and lightweighting reduce emissions and shipping cost. 10) Consumer storytelling shifts to proof‑based benefits: durability, safety, and verified recycling outcomes.
Segment Analysis
Food & Beverage: Mono‑material films, clear PET, and fiber trays; freshness coatings; deposit/return pilots for beverages. Beauty & Personal Care: Refill pods, high‑PCR rigid packs, security inks; premiumization with verified claims. Home Care: Concentrates and lightweight pouches; child‑safe closures. OTC/Pharma‑adjacent: Tamper evidence and serialization; barrier‑sensitive choices. Premium Gifting: Fiber‑first and reusable packaging. Across segments, define specs, barrier needs, and identity features; track unit cost, PCR %, damage %, WTP %, and preference lift.
Geography Analysis
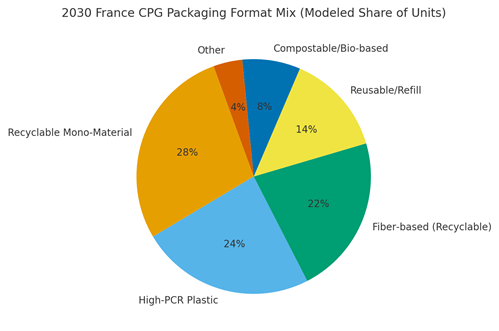
By 2030, modeled France format mix is Recyclable Mono‑Material (~28%), High‑PCR Plastic (~24%), Fiber‑based (~22%), Reusable/Refill (~14%), Compostable/Bio‑based (~8%), and Other (~4%). Urban regions adopt refill/reuse earlier; national chains push mono‑material and high‑PCR for scale. The pie figure reflects the mix.
Execution: align specs with French/EU labeling rules; stage pilots in Île‑de‑France and high‑density cities; and scale with multi‑sourced PCR and fiber. Measure region‑specific unit cost, PCR %, damage %, and brand preference lift; rebalance budgets quarterly.
Competitive Landscape
Converters, resin/fiber suppliers, and identity/security vendors compete to serve brand owners standardizing sustainable specs. Differentiation vectors: (1) PCR/fiber reliability and certification, (2) barrier performance compatible with recycling streams, (3) cost and changeover speed, (4) identity & security features (QR/NFC, inks), and (5) compliance and audit support. Procurement guidance: require recycled‑content certificates, migration testing, and spec libraries with open change logs. Competitive KPIs: unit cost, PCR %, damage %, WTP %, preference lift, compliance fees avoided, and time‑to‑line.
Report Details
Proceed To Buy
Want a More Customized Experience?
- Request a Customized Transcript: Submit your own questions or specify changes. We’ll conduct a new call with the industry expert, covering both the original and your additional questions. You’ll receive an updated report for a small fee over the standard price.
- Request a Direct Call with the Expert: If you prefer a live conversation, we can facilitate a call between you and the expert. After the call, you’ll get the full recording, a verbatim transcript, and continued platform access to query the content and more.
68 Circular Road, #02-01 049422, Singapore
Revenue Tower, Scbd, Jakarta 12190, Indonesia
4th Floor, Pinnacle Business Park, Andheri East, Mumbai, 400093
Cinnabar Hills, Embassy Golf Links Business Park, Bengaluru, Karnataka 560071
Request Custom Transcript
Related Transcripts

$ 1395


68 Circular Road, #02-01 049422, Singapore
Revenue Tower, Scbd, No.52-53, Jakarta 12190, Indonesia
Cinnabar Hills, Embassy Golf Links Business Park, Bengaluru, Karnataka 560071
4th Floor, Pinnacle Business Park, Andheri East, Mumbai, 400093


68 Circular Road, #02-01 049422, Singapore
Revenue Tower, Scbd, Jakarta 12190, Indonesia
4th Floor, Pinnacle Business Park, Andheri East, Mumbai, 400093
Cinnabar Hills, Embassy Golf Links Business Park, Bengaluru, Karnataka 560071