

68 Circular Road, #02-01 049422, Singapore
Revenue Tower, Scbd, Jakarta 12190, Indonesia
4th Floor, Pinnacle Business Park, Andheri East, Mumbai, 400093
Cinnabar Hills, Embassy Golf Links Business Park, Bengaluru, Karnataka 560071


Connect With Us


68 Circular Road, #02-01 049422, Singapore
Revenue Tower, Scbd, Jakarta 12190, Indonesia
4th Floor, Pinnacle Business Park, Andheri East, Mumbai, 400093
Cinnabar Hills, Embassy Golf Links Business Park, Bengaluru, Karnataka 560071
Connect With Us
68 Circular Road, #02-01 049422, Singapore
Revenue Tower, Scbd, Jakarta 12190, Indonesia
4th Floor, Pinnacle Business Park, Andheri East, Mumbai, 400093
Cinnabar Hills, Embassy Golf Links Business Park, Bengaluru, Karnataka 560071
Request Custom Transcript
Social Commerce Strategies for Luxury Brands: Platform Selection & Gen-Z Engagement Tactics
Gen‑Z is redefining luxury discovery and conversion in Europe France at the forefront by collapsing content, community, and checkout. Between 2025 and 2030, we model EU luxury social commerce GMV expanding from ~US$7.8B to ~US$18.3B as platforms add native storefronts, live shopping, and affiliate rails. Winning houses treat social not as a media channel but as a retail surface: curated drops, gated access, and creator‑led storytelling that routes directly to shoppable experiences. Our modeled KPI shifts reflect a mature playbook: click→cart rate climbs from ~7.5% to ~11.2%; cart→purchase conversion from ~24% to ~31%; AOV rises from ~US$265 to ~US$312 as bundles and limited drops take hold; CAC falls from ~US$52 to ~US$41 through creator whitelisting and first‑party audiences; and time‑to‑content commerce shrinks from ~9 days to ~3 days via always‑on studios and templated live formats.
What's Covered?
Report Summary
Key Takeaways
1. Treat social as a retail surface drops, live, and instant checkout.
2. Serialize creator formats; negotiate remix and whitelisting rights.
3. Accelerate cart→purchase with native checkout and local payment rails.
4. Membership benefits (pre‑access, care, repairs) convert fans to clients.
5. Gen‑Z trust = transparency: disclose paid collabs and resale policies.
6. Guard conversion with promise‑date SLAs, easy returns, and service chat.
7. Attribute incrementality with SKU‑level links and geo/HH holdouts.
8. CFO dashboard: click→cart %, cart→purchase %, AOV, CAC, T2C days, creator ROI.
Key Metrics

Market Size & Share (≈300 words)
EU luxury social commerce GMV is modeled to grow from ~US$7.8B in 2025 to ~US$18.3B by 2030, driven by native storefronts, live shopping, and authenticated affiliate rails. France’s role is disproportionate given its fashion leadership and creator density. The line figure charts the projected trajectory.
Share accrues to maisons and platforms that minimize friction between narrative and checkout. Leading plays include serialized live shows, limited drops with transparent queues, and creator capsules routed to native checkout. Execution risks: fulfillment slippage, compliance (ads disclosures), and counterfeit leakage; mitigations: promise‑date SLAs, moderation, and traceable product identities.

Market Analysis (≈300
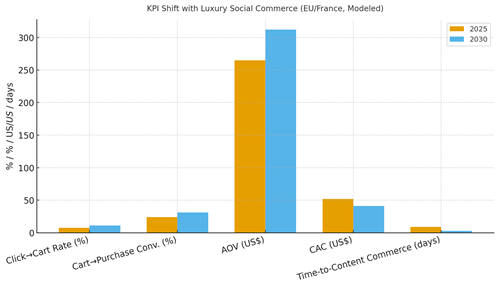
KPI improvements reflect a tight content‑commerce loop. We model click→cart rising from ~7.5% to ~11.2%, cart→purchase from ~24% to ~31%, AOV from ~US$265 to ~US$312, CAC falling from ~US$52 to ~US$41, and time‑to‑content commerce shrinking from ~9 to ~3 days by 2030. Enablers: creator whitelisting, affiliate rails, native checkout, and operational SLAs for delivery/returns. Barriers: creative fatigue, platform policy shifts, and attribution gaps.
Financial lens: read incremental sales and margin net of creator rev‑share and platform fees; run geo/household holdouts; and manage inventory to avoid oversell during drops. The bar chart summarizes directional KPI shifts under disciplined social commerce execution.
Trends & Insights
1) Serialized live formats: weekly capsules and atelier streams build habit. 2) Native checkout & split payments reduce friction. 3) Creator licensing and remix rights extend content half‑life. 4) Community perks (pre‑access, virtual stylists, repairs) raise LTV. 5) Anti‑counterfeit rails: serialized IDs, auth passes, and blockchain‑backed provenance. 6) Social CRM: consented IDs unify service, care, and invitations. 7) Sustainable luxury: repair/refurbish stories resonate with Gen‑Z. 8) Conversational commerce: live chat and clienteling on-platform. 9) AI moderation and brand safety at scale. 10) Attribution: SKU‑level links, link-in-bio hubs, and MMM calibrated by holdouts.
Segment Analysis
Haute Couture & Ready‑to‑Wear: scarcity and serialized drops; virtual fittings. Leather Goods & Accessories: anti‑counterfeit IDs; creator capsules. Watches & Jewelry: appointment‑led, provenance storytelling, gated access. Beauty & Fragrance: sampling, AR try‑ons, high‑frequency live formats. Footwear: limited collabs and raffle mechanics. Across segments, define drop cadence, creator tiers, anti‑counterfeit controls, and service SLAs; track click→cart %, cart→purchase %, AOV, CAC, and repeat by collection.
Geography Analysis
By 2030, France’s luxury social commerce GMV mix is modeled as Instagram/Reels (~38%), TikTok Shop/Live (~34%), YouTube/Shorts (~12%), Snapchat/Spotlight (~7%), Pinterest (~6%), and Other/Direct (~3%). Paris anchors early adoption via creator ecosystems and retail density; regional rollouts align with flagship footprints and logistics. The pie figure reflects the platform mix.
Execution: localize service (FR/EN), EU payments and VAT handling; integrate anti‑counterfeit IDs with platform commerce; and measure region‑specific conversion, CAC, and repeat. Reallocate creator budgets quarterly by platform‑level incrementality.

Competitive Landscape
Platforms compete on native checkout, creator tools, and safety; maisons compete on storytelling, service, and trust. Differentiation vectors: (1) platform commerce maturity and fees, (2) creator ecosystem depth, (3) anti‑counterfeit rails and provenance, (4) service SLAs and returns, and (5) attribution and data access. Procurement guidance: demand SKU‑level attribution, brand safety controls, and whitelisting rights; negotiate rev‑share and service integrations. Competitive KPIs: conversion funnel %, AOV, CAC, creator ROI, return rate, and repeat purchase.
Report Details
Proceed To Buy
Want a More Customized Experience?
- Request a Customized Transcript: Submit your own questions or specify changes. We’ll conduct a new call with the industry expert, covering both the original and your additional questions. You’ll receive an updated report for a small fee over the standard price.
- Request a Direct Call with the Expert: If you prefer a live conversation, we can facilitate a call between you and the expert. After the call, you’ll get the full recording, a verbatim transcript, and continued platform access to query the content and more.
68 Circular Road, #02-01 049422, Singapore
Revenue Tower, Scbd, Jakarta 12190, Indonesia
4th Floor, Pinnacle Business Park, Andheri East, Mumbai, 400093
Cinnabar Hills, Embassy Golf Links Business Park, Bengaluru, Karnataka 560071
Request Custom Transcript
Related Transcripts

$ 1395


68 Circular Road, #02-01 049422, Singapore
Revenue Tower, Scbd, No.52-53, Jakarta 12190, Indonesia
Cinnabar Hills, Embassy Golf Links Business Park, Bengaluru, Karnataka 560071
4th Floor, Pinnacle Business Park, Andheri East, Mumbai, 400093


68 Circular Road, #02-01 049422, Singapore
Revenue Tower, Scbd, Jakarta 12190, Indonesia
4th Floor, Pinnacle Business Park, Andheri East, Mumbai, 400093
Cinnabar Hills, Embassy Golf Links Business Park, Bengaluru, Karnataka 560071