

68 Circular Road, #02-01 049422, Singapore
Revenue Tower, Scbd, Jakarta 12190, Indonesia
4th Floor, Pinnacle Business Park, Andheri East, Mumbai, 400093
Cinnabar Hills, Embassy Golf Links Business Park, Bengaluru, Karnataka 560071


Connect With Us


68 Circular Road, #02-01 049422, Singapore
Revenue Tower, Scbd, Jakarta 12190, Indonesia
4th Floor, Pinnacle Business Park, Andheri East, Mumbai, 400093
Cinnabar Hills, Embassy Golf Links Business Park, Bengaluru, Karnataka 560071
Connect With Us
68 Circular Road, #02-01 049422, Singapore
Revenue Tower, Scbd, Jakarta 12190, Indonesia
4th Floor, Pinnacle Business Park, Andheri East, Mumbai, 400093
Cinnabar Hills, Embassy Golf Links Business Park, Bengaluru, Karnataka 560071
Request Custom Transcript
Smart Shelf 2.0: Computer Vision Analytics & Dynamic Planogram Optimization in US Big-Box Retail
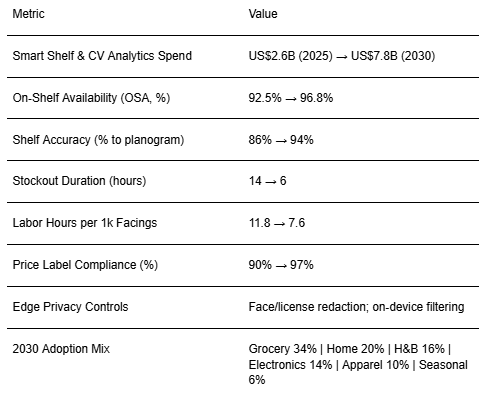
Smart Shelf 2.0 combines computer vision (CV), edge sensors, and dynamic planogram engines to eliminate phantom inventory, raise on‑shelf availability (OSA), and compress labor in U.S. big‑box retail. Between 2025 and 2030, North American spend on shelf‑level CV analytics and dynamic planogram systems is modeled to grow from ~US$2.6B to ~US$7.8B. The operating pattern: cameras and imaging bars detect gaps, misplacements, and facing counts; an engine reflows planograms in near real time based on demand, space elasticity, promo calendars, and service constraints; tasks are pushed to associates via micro‑workflows and robots for restock or facing rebuilds. KPI impact (modeled): OSA improves from ~92.5% to ~96.8%; shelf accuracy rises from ~86% to ~94%; stockout duration falls from ~14 to ~6 hours; labor hours per 1k facings drop from ~11.8 to ~7.6 through targeted tasks; and price‑label compliance increases from ~90% to ~97% via CV checks. Benefits flow to sales lift, markdown avoidance, and labor productivity.
What's Covered?
Report Summary
Key Takeaways
1. CV closes the loop on OSA: detect, prioritize, and fix gaps fast.
2. Dynamic planograms reallocate facings by localized demand and elasticity.
3. Tasking beats sweeps: micro‑workflows target the highest‑value fixes.
4. Edge privacy and QA sampling sustain trust and model performance.
5. Pricing and label compliance are enforced continuously by CV.
6. Robots and AMRs handle heavy/low‑value replenishment to free associates.
7. Vendor negotiations use verified shelf data, reducing audit disputes.
8. CFO dashboard: OSA %, shelf accuracy %, stockout hours, labor hrs/1k facings, price compliance %.
Key Metrics
Market Size & Share
North American spend on smart shelf CV analytics and dynamic planogram platforms is modeled to rise from ~US$2.6B (2025) to ~US$7.8B (2030). Early wins emerge in high‑velocity, high‑margin zones (endcaps, beverages, HBA) and in categories with frequent resets. The line figure charts the projected trajectory.
Stack share: imaging/camera hardware; edge compute; CV and SKU recognition models; planogram optimization engines; task orchestration; and analytics. Share accrues to platforms that tie real‑time detection to immediate tasking and measurable assortment/space changes. Execution risks include packaging refreshes that break recognition, glare/lighting variance, and integration debt; mitigations are vendor image pipelines, QA audits, and edge HDR imaging.

Market Analysis
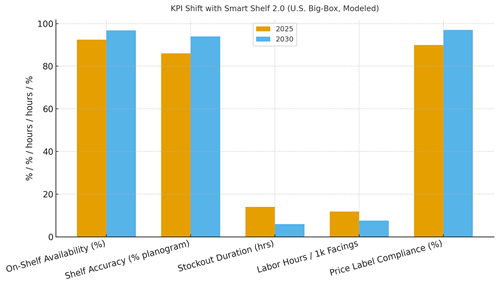
KPI improvements span availability, accuracy, labor, price compliance, and stockout duration. We model OSA rising from ~92.5% to ~96.8%, shelf accuracy from ~86% to ~94%, stockout duration falling from ~14 to ~6 hours, labor hours per 1k facings dropping from ~11.8 to ~7.6, and price label compliance from ~90% to ~97% by 2030. Enablers: robust SKU libraries, edge CV with privacy filtering, dynamic planogram engines, and AMR‑assisted replenishment. Barriers: model drift, lighting variance, and change management.
Financial lens: attribute to incremental sales and markdown avoidance from higher OSA and accuracy; compute labor savings from targeted tasking; and factor capex/opex for cameras, edge devices, and software. The bar chart summarizes directional KPI lifts under disciplined deployment.
Trends & Insights
1) Event‑driven merchandising replaces fixed sweeps. 2) Space elasticity models connect facings to sales lift at the SKU‑cluster level. 3) Privacy‑first edge CV becomes standard (face/license redaction, minimal retention). 4) Planogram engines consider online demand and BOPIS pull‑downs. 5) AMRs take on repetitive restock and facing. 6) Vendor scorecards use verified shelf data. 7) Seasonal AI templates accelerate resets. 8) Computer graphics assist SKU recognition during packaging refreshes. 9) Multi‑modal signals (weight rails, RFID) backstop CV. 10) Unified merch+ops dashboards guide daily decisions.
Segment Analysis
Grocery & Consumables: High turnover; biggest OSA gains; CV for gaps and date checks. Home & DIY: Bulky items and planogram complexity; AMRs help. Health & Beauty: Small facings; high ROI from accuracy and price‑tag compliance. Electronics: High value; theft/ticketing checks; display resets. Apparel: Facing integrity and size availability; shelf/case vision hybrids. Seasonal/General: Frequent resets; template‑driven planograms. Across segments, define thresholds, QA sampling, and AMR roles; track OSA %, shelf accuracy %, stockout hours, labor hrs/1k facings, and price compliance %.
Geography Analysis
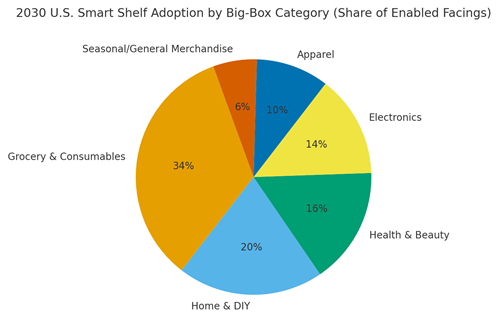
By 2030, the share of smart‑shelf enabled facings in U.S. big‑box is modeled as Grocery & Consumables (~34%), Home & DIY (~20%), Health & Beauty (~16%), Electronics (~14%), Apparel (~10%), and Seasonal/General (~6%). Coastal and tech‑dense markets roll out earlier due to labor costs and pilot proximity; broad deployment follows as edge hardware costs fall and models stabilize. The pie figure captures category adoption.
Execution: standardize camera placement and lighting specs; stage rollouts by zone; and measure geography‑specific sales lift vs control stores. Rebalance CAPEX to districts with the strongest OSA and labor gains.
Competitive Landscape
Camera/edge vendors, CV recognition platforms, planogram optimization suites, and AMR providers are converging. Differentiation vectors: (1) detection precision/recall at shelf, (2) robustness to packaging changes and lighting, (3) speed from detection to task completion, (4) privacy controls and audits, (5) open APIs and integration to RMS/WMS/POS. Procurement guidance: demand SKU‑level benchmarks on precision/recall, on‑device redaction, and proof of task‑to‑sales impact. Competitive KPIs: OSA %, shelf accuracy %, stockout hours, labor hrs/1k facings, price compliance %, precision/recall metrics.
Report Details
Proceed To Buy
Want a More Customized Experience?
- Request a Customized Transcript: Submit your own questions or specify changes. We’ll conduct a new call with the industry expert, covering both the original and your additional questions. You’ll receive an updated report for a small fee over the standard price.
- Request a Direct Call with the Expert: If you prefer a live conversation, we can facilitate a call between you and the expert. After the call, you’ll get the full recording, a verbatim transcript, and continued platform access to query the content and more.
68 Circular Road, #02-01 049422, Singapore
Revenue Tower, Scbd, Jakarta 12190, Indonesia
4th Floor, Pinnacle Business Park, Andheri East, Mumbai, 400093
Cinnabar Hills, Embassy Golf Links Business Park, Bengaluru, Karnataka 560071
Request Custom Transcript
Related Transcripts

$ 1395


68 Circular Road, #02-01 049422, Singapore
Revenue Tower, Scbd, No.52-53, Jakarta 12190, Indonesia
Cinnabar Hills, Embassy Golf Links Business Park, Bengaluru, Karnataka 560071
4th Floor, Pinnacle Business Park, Andheri East, Mumbai, 400093


68 Circular Road, #02-01 049422, Singapore
Revenue Tower, Scbd, Jakarta 12190, Indonesia
4th Floor, Pinnacle Business Park, Andheri East, Mumbai, 400093
Cinnabar Hills, Embassy Golf Links Business Park, Bengaluru, Karnataka 560071