

68 Circular Road, #02-01 049422, Singapore
Revenue Tower, Scbd, Jakarta 12190, Indonesia
4th Floor, Pinnacle Business Park, Andheri East, Mumbai, 400093
Cinnabar Hills, Embassy Golf Links Business Park, Bengaluru, Karnataka 560071


Connect With Us


68 Circular Road, #02-01 049422, Singapore
Revenue Tower, Scbd, Jakarta 12190, Indonesia
4th Floor, Pinnacle Business Park, Andheri East, Mumbai, 400093
Cinnabar Hills, Embassy Golf Links Business Park, Bengaluru, Karnataka 560071
Connect With Us
68 Circular Road, #02-01 049422, Singapore
Revenue Tower, Scbd, Jakarta 12190, Indonesia
4th Floor, Pinnacle Business Park, Andheri East, Mumbai, 400093
Cinnabar Hills, Embassy Golf Links Business Park, Bengaluru, Karnataka 560071
Request Custom Transcript
Smart Packaging 2.0: IoT-Enabled Freshness Tracking & Anti-Counterfeit Solutions
Smart Packaging 2.0 fuses low‑cost sensors, secure identities, and cloud analytics to protect product integrity and unlock margin in North America. From 2025 to 2030, retailers and brands move beyond passive dates and batch codes to dynamic freshness scoring and unit‑level authentication. We model regional spend on IoT‑enabled freshness and anti‑counterfeit solutions rising from ~US$4.3B (2025) to ~US$10.7B (2030). Value creation shows up as lower spoilage, faster recalls, fewer counterfeit incidents, higher on‑shelf availability (OSA), and better demand sensing in cold chains. Technology stack: (1) sensing time‑temperature indicators (TTIs), gas sensors, moisture and shock; (2) identity & security serialized QR/NFC with cryptographic signatures and hardware roots of trust; (3) connectivity BLE/NFC scans, gateway readers, and event streaming; (4) analytics freshness algorithms, anomaly detection, and geofencing; and (5) applications recall workflows, consumer provenance apps, and theft/counterfeit deterrence. Operational design integrates with WMS/TMS/ERP and retailer apps to avoid scan fatigue and to automate disposition rules (discount, discard, re‑route).
What's Covered?
Report Summary
Key Takeaways
1. Dynamic freshness scoring beats static date codes for waste and safety.
2. Unit‑level cryptographic IDs deter counterfeits and enable authenticated resale.
3. Recall automation and geofencing compress response times dramatically.
4. OSA lifts as expiring lots trigger smart rotation and markdown rules.
5. Edge logging + signed events reduce connectivity and tamper risks.
6. Cost curves (<$0.30/tag) make scaled deployment feasible for perishables.
7. Privacy‑safe consumer scans unlock provenance and loyalty use‑cases.
8. CFO dashboard: spoilage %, counterfeit/10k, OSA %, recall hours, traceability %, and unit cost.
Key Metrics
Market Size & Share
North American spend on smart packaging for freshness and anti‑counterfeit is modeled to grow from ~US$4.3B (2025) to ~US$10.7B (2030). Early value pools are perishables (produce, meat/seafood, dairy) and high‑risk categories (pharmaceuticals, cosmetics & luxury). The line figure shows the projected trajectory. Share accrues to players that can combine low‑cost tags with secure identity and analytics at chain scale.
Stack shares: sensing/tag hardware, identity/security services, connectivity/gateways, analytics platforms, and applications (recalls, provenance, dynamic pricing). Execution risks: tag tampering, interoperability gaps, and scan fatigue; mitigations: cryptographic signatures, standards‑based IDs, edge logging, and workflow design that rewards scans with time savings or consumer value.

Market Analysis
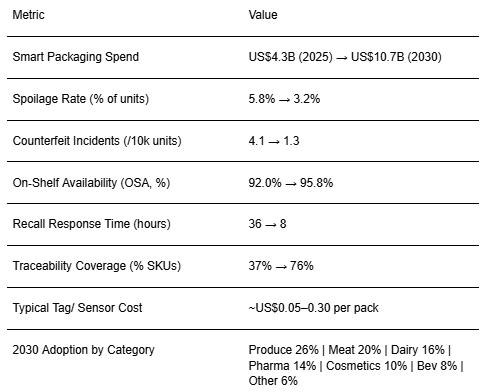
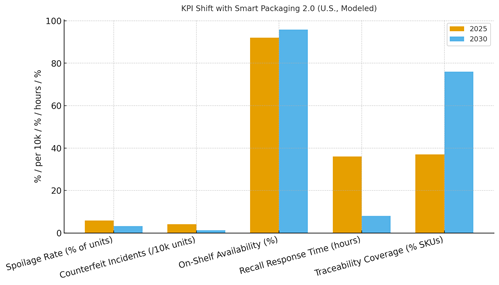
Modeled KPI shifts reflect waste reduction and risk mitigation at scale. Spoilage rate drops from ~5.8% to ~3.2% as dynamic freshness scores trigger rotation/markdowns; counterfeit incidents fall from ~4.1 to ~1.3 per 10k through unit‑level authentication; OSA rises from ~92.0% to ~95.8%; recall response time compresses from ~36 to ~8 hours via geofenced workflows; and traceability expands from ~37% to ~76% of SKUs. Enablers: TTIs/gas sensors, NFC/QR with signed IDs, BLE gateways, and event‑stream analytics. Barriers: tag costs for low‑margin SKUs, store labor bandwidth, and privacy policies.
Financial lens: attribute savings from avoided waste and recalls; add revenue from authenticated resale/refill; and net against tag/cloud costs and labor. The bar chart summarizes directional improvements under disciplined deployment.
Trends & Insights
1) Freshness‑based pricing and auto‑markdowns reduce waste and boost sell‑through. 2) Cryptographically signed IDs deter counterfeit/gray‑market leakage. 3) Consumer provenance apps enable loyalty accrual and refill programs. 4) Edge analytics lower cloud costs and reduce latency. 5) Standards emerge for event schemas and keys rotation. 6) Sustainability reporting uses sensor trails as evidence. 7) Retailer–brand data clean rooms support shared telemetry. 8) Reusable packaging with embedded tags scales in closed loops. 9) Cold chain orchestration aligns route/slotting with freshness scores. 10) Insurance and finance products discount risk where sensor evidence is available.
Segment Analysis
Produce: TTIs and gas sensors drive rotation and markdowns; high waste reduction. Meat & Seafood: Cold chain visibility; tamper‑evident seals; recall speed. Dairy: Temperature shock detection and date extension via dynamic scoring. Pharmaceuticals: Unit‑level authentication and chain‑of‑custody; regulatory reporting. Cosmetics & Luxury: Anti‑counterfeit, provenance, and authenticated resale. Beverages: Refill/return loops and freshness exposure monitoring. Across segments, define tag types, scan points, retention windows, and KPIs; track spoilage %, counterfeit/10k, OSA %, recall hours, and traceability %.
Geography Analysis
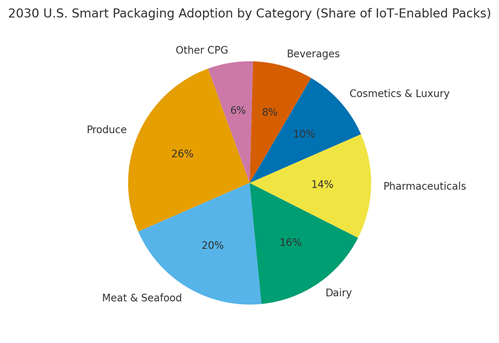
By 2030, modeled U.S. adoption share of IoT‑enabled packs is Produce (~26%), Meat & Seafood (~20%), Dairy (~16%), Pharmaceuticals (~14%), Cosmetics & Luxury (~10%), Beverages (~8%), and Other CPG (~6%). Coastal metros adopt faster due to cold‑chain density and brand protection priorities; interior regions scale through DC‑led tagging. The pie figure reflects category adoption.
Execution: prioritize high‑loss markets and routes; co‑fund tags with brands where recall risk concentrates; and stage rollouts from DCs to stores to consumers. Measure region‑specific spoilage, counterfeit, OSA, and recall time; reallocate tags to hotspots quarterly.
Competitive Landscape
Sensor/tag makers, identity/security providers, and cloud/edge platforms converge to compete with vertically integrated solutions. Differentiation vectors: (1) tag cost and durability, (2) cryptographic security and anti‑tamper, (3) gateway coverage and edge analytics, (4) workflow apps for recalls/markdowns, (5) interoperability and standards compliance. Procurement guidance: require signed IDs, open APIs, offline logging, and audited freshness/counterfeit metrics. Competitive KPIs: spoilage %, counterfeit/10k, OSA %, recall hours, traceability %, unit cost per pack, and time‑to‑value.
Report Details
Proceed To Buy
Want a More Customized Experience?
- Request a Customized Transcript: Submit your own questions or specify changes. We’ll conduct a new call with the industry expert, covering both the original and your additional questions. You’ll receive an updated report for a small fee over the standard price.
- Request a Direct Call with the Expert: If you prefer a live conversation, we can facilitate a call between you and the expert. After the call, you’ll get the full recording, a verbatim transcript, and continued platform access to query the content and more.
68 Circular Road, #02-01 049422, Singapore
Revenue Tower, Scbd, Jakarta 12190, Indonesia
4th Floor, Pinnacle Business Park, Andheri East, Mumbai, 400093
Cinnabar Hills, Embassy Golf Links Business Park, Bengaluru, Karnataka 560071
Request Custom Transcript
Related Transcripts


68 Circular Road, #02-01 049422, Singapore
Revenue Tower, Scbd, No.52-53, Jakarta 12190, Indonesia
Cinnabar Hills, Embassy Golf Links Business Park, Bengaluru, Karnataka 560071
4th Floor, Pinnacle Business Park, Andheri East, Mumbai, 400093


68 Circular Road, #02-01 049422, Singapore
Revenue Tower, Scbd, Jakarta 12190, Indonesia
4th Floor, Pinnacle Business Park, Andheri East, Mumbai, 400093
Cinnabar Hills, Embassy Golf Links Business Park, Bengaluru, Karnataka 560071