

68 Circular Road, #02-01 049422, Singapore
Revenue Tower, Scbd, Jakarta 12190, Indonesia
4th Floor, Pinnacle Business Park, Andheri East, Mumbai, 400093
Cinnabar Hills, Embassy Golf Links Business Park, Bengaluru, Karnataka 560071


Connect With Us


68 Circular Road, #02-01 049422, Singapore
Revenue Tower, Scbd, Jakarta 12190, Indonesia
4th Floor, Pinnacle Business Park, Andheri East, Mumbai, 400093
Cinnabar Hills, Embassy Golf Links Business Park, Bengaluru, Karnataka 560071
Connect With Us
68 Circular Road, #02-01 049422, Singapore
Revenue Tower, Scbd, Jakarta 12190, Indonesia
4th Floor, Pinnacle Business Park, Andheri East, Mumbai, 400093
Cinnabar Hills, Embassy Golf Links Business Park, Bengaluru, Karnataka 560071
Request Custom Transcript
Private Label Expansion Post-Inflation: Share Gains, Consumer Perception & Margin Impact
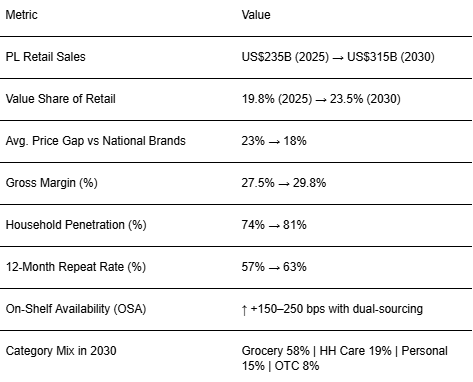
Private label (PL) momentum in the U.S. is shifting from short‑term trade‑down to durable preference. As inflation cools yet price sensitivity persists, retailers are professionalizing PL portfolios premium tiers for quality seekers, value tiers for budget shoppers, and wellness/clean‑label micro‑ranges for credibility. Between 2025 and 2030, we model U.S. PL retail sales expanding from ~US$235B to ~US$315B with value share rising from ~19.8% to ~23.5%. Growth is not purely price‑led: improved sensory, packaging, and guarantees lift repeat and protect margin, while supply consolidation and demand planning reduce out‑of‑stocks. Economics hinge on three levers. First, the price gap to national brands narrows from ~23% to ~18% as PL quality improves, and promo depth is disciplined; gross margin still expands (from ~27.5% to ~29.8%) via owned‑brand sourcing, pack/size architecture, and lower slotting/MDAs. Second, penetration grows from ~74% to ~81% of households, with 12‑month repeat rising from ~57% to ~63% as trust and availability improve. Third, mix matters: grocery remains the anchor, while household and personal care accelerate on efficacy and sustainability claims; OTC grows through retailer‑clinic ecosystems and telehealth.
What's Covered?
Report Summary
Key Takeaways
1. PL growth becomes preference‑led as quality, design, and guarantees improve.
2. Price gap narrows yet margin expands via sourcing, packs, and promo discipline.
3. Penetration + repeat lift as stigma fades and availability tightens.
4. Category playbooks diverge: grocery anchors, HPC/OTC accelerate on efficacy claims.
5. Data‑driven ladders optimize price/pack/facing at aisle level.
6. Dual‑sourcing and SRP packaging improve OSA and labor productivity.
7. Claims governance (allergens, sustainability) preserves trust and speed to shelf.
8. CFO dashboard: share, price gap, margin %, penetration, repeat, OSA, and cannibalization.
Key Metrics
Market Size & Share
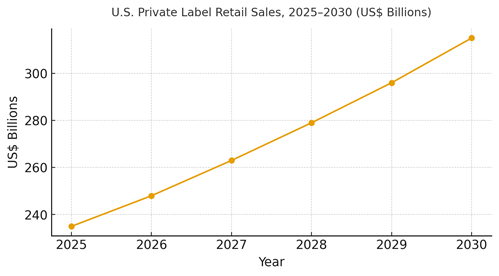
U.S. private label retail sales are modeled to grow from ~US$235B in 2025 to ~US$315B by 2030, with value share expanding from ~19.8% to ~23.5%. Share gains stem from quality upgrades, improved on‑shelf availability, and a clearer brand architecture that reduces stigma. Grocery remains the anchor value pool, while household/personal care and OTC capture faster growth as efficacy and safety claims mature. The line figure shows the trajectory.
Share dynamics: retailers with disciplined price ladders, vendor consolidation, and reformulation roadmaps will outgrow peers. Risks include quality missteps, assortment bloat, and promo wars that reset reference prices. Mitigations: sensory governance, SRP packaging, and data‑driven pack architecture by channel (ecomm, club, convenience).
Market Analysis
Post‑inflation PL strategies move KPIs in a coordinated way. We model value share rising ~380 bps, the average price gap narrowing from ~23% to ~18%, gross margin expanding from ~27.5% to ~29.8%, household penetration increasing from ~74% to ~81%, and 12‑month repeat improving from ~57% to ~63% by 2030. Enablers: owned‑brand sourcing, dual‑sourcing for resilience, reformulations to remove off‑notes/allergens, and pack architecture tuned to channel. Barriers: inconsistent quality, excessive SKU counts, and heavy promos.
Financial lens: attribute to incremental gross margin dollars net of promo depth, slotting, and CDMO fees; measure cannibalization vs true incrementality with store/region holdouts and matched‑market tests. The bar chart summarizes directional KPI shifts when PL is run as a performance discipline.

Trends & Insights
1) Premiumization within PL: chef‑inspired, dermatologist‑tested, and clean‑label lines. 2) Functional claims shift from vague to tested; data rooms for buyers shorten cycles. 3) Shelf‑ready packaging improves labor and OSA. 4) Pack/size architecture by mission: pantry stock vs trial vs club. 5) Return and guarantee policies as confidence levers. 6) Sustainability proofs: recycled content and verified sourcing credibly communicated. 7) Retail media synergy: first‑party audiences amplify PL launches. 8) Club and e-comm growth pull larger formats and subscription SKUs. 9) Store design: PL discovery bays and endcaps act as mini‑brands. 10) Governance: claim substantiation, allergen clarity, and quality telemetry reduce downside risk.
Segment Analysis
Grocery: Core pantry, fresh, and frozen; focus on taste, OSA, and pack value ladders. Household Care: Efficacy, safety certifications, and concentrated formats; margin accretive with disciplined claims. Personal Care: Dermatologist‑tested, fragrance‑free variants; risk‑managed claims and sampling drive trial. OTC/Health: Pharmacy‑adjacent credibility; dosage accuracy, tamper evidence, and telehealth tie‑ins. Across segments, define good/better/best tiers, align packaging to shelf and e-comm, and measure repeat and margin by sub‑category.
Geography Analysis
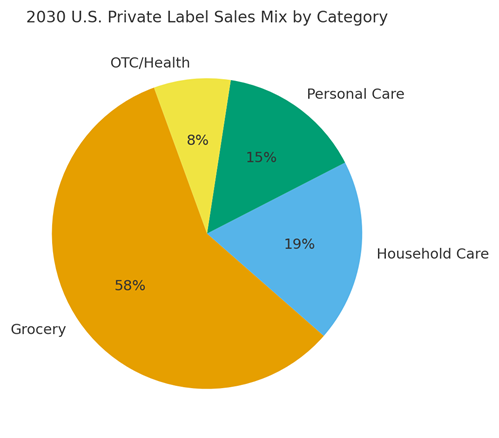
By 2030, category mix is modeled at Grocery (~58%), Household Care (~19%), Personal Care (~15%), and OTC/Health (~8%). Regional growth differs: coastal metros emphasize premium/clean‑label PL, while value tiers over‑index in price‑sensitive regions. Omnichannel nuances matter club/ecomm dominate large pack adoption in suburbs; convenience and smaller packs matter in dense urban cores. The pie figure illustrates category mix for 2030.
Execution: localize assortments to regional palates and price elasticity; tune pack sizes by mission; and calibrate promo depth to avoid resetting reference prices. Track region‑specific share, penetration, repeat, OSA, and margin dollars.
Competitive Landscape
Incumbent grocers and mass merchants leverage scale, sourcing, and retail media; warehouse clubs drive pack/value innovation; discounters win on simplicity; and ecomm platforms accelerate PL discovery and subscriptions. Differentiation vectors: (1) sourcing depth and dual‑sourcing resilience, (2) sensory and efficacy governance, (3) price ladder science by aisle, (4) packaging for shelf and ecomm, and (5) clean claims with substantiation. Procurement guidance: demand transparent QA, data‑sharing, and service‑level commitments from manufacturers; require evidence for claims and sustainability. Competitive KPIs: value share, price gap, gross margin %, penetration, repeat, OSA, and cannibalization vs incrementality.
Report Details
Proceed To Buy
Want a More Customized Experience?
- Request a Customized Transcript: Submit your own questions or specify changes. We’ll conduct a new call with the industry expert, covering both the original and your additional questions. You’ll receive an updated report for a small fee over the standard price.
- Request a Direct Call with the Expert: If you prefer a live conversation, we can facilitate a call between you and the expert. After the call, you’ll get the full recording, a verbatim transcript, and continued platform access to query the content and more.
68 Circular Road, #02-01 049422, Singapore
Revenue Tower, Scbd, Jakarta 12190, Indonesia
4th Floor, Pinnacle Business Park, Andheri East, Mumbai, 400093
Cinnabar Hills, Embassy Golf Links Business Park, Bengaluru, Karnataka 560071
Request Custom Transcript
Related Transcripts

$ 1395


68 Circular Road, #02-01 049422, Singapore
Revenue Tower, Scbd, No.52-53, Jakarta 12190, Indonesia
Cinnabar Hills, Embassy Golf Links Business Park, Bengaluru, Karnataka 560071
4th Floor, Pinnacle Business Park, Andheri East, Mumbai, 400093


68 Circular Road, #02-01 049422, Singapore
Revenue Tower, Scbd, Jakarta 12190, Indonesia
4th Floor, Pinnacle Business Park, Andheri East, Mumbai, 400093
Cinnabar Hills, Embassy Golf Links Business Park, Bengaluru, Karnataka 560071