

68 Circular Road, #02-01 049422, Singapore
Revenue Tower, Scbd, Jakarta 12190, Indonesia
4th Floor, Pinnacle Business Park, Andheri East, Mumbai, 400093
Cinnabar Hills, Embassy Golf Links Business Park, Bengaluru, Karnataka 560071


Connect With Us


68 Circular Road, #02-01 049422, Singapore
Revenue Tower, Scbd, Jakarta 12190, Indonesia
4th Floor, Pinnacle Business Park, Andheri East, Mumbai, 400093
Cinnabar Hills, Embassy Golf Links Business Park, Bengaluru, Karnataka 560071
Connect With Us
68 Circular Road, #02-01 049422, Singapore
Revenue Tower, Scbd, Jakarta 12190, Indonesia
4th Floor, Pinnacle Business Park, Andheri East, Mumbai, 400093
Cinnabar Hills, Embassy Golf Links Business Park, Bengaluru, Karnataka 560071
Request Custom Transcript
ESG-Driven Supply Chain Analytics: Carbon Accounting & Supplier Risk Mitigation Frameworks
Between 2025 and 2030, the U.S. market for ESG-driven supply chain analytics transitions from compliance-led pilots to scaled platforms that blend carbon accounting, Scope 3 visibility, and supplier risk scoring. We model revenue expanding from ~$4.2B in 2025 to ~$9.9B in 2030 (~18% CAGR), with carbon accounting SaaS and supplier-risk analytics capturing the largest share. Adoption accelerates as listed companies publish audited emissions, customers demand product-level footprints, and lenders embed climate risk into underwriting. Vendors compete on three vectors: data completeness (supplier coverage and primary data), defensibility of methods (emissions factors, allocation rules, audit trails), and workflow fit (integrations, dashboards, remediation programs). Network data exchanges where buyers and suppliers co-manage datasets and audit artifacts emerge as a growth hotspot, while consulting spend remains ~18% in 2030 for ERP/PLM integration and supplier onboarding. Scope 3 visibility is the battleground: by 2030, roughly half of large U.S. enterprises maintain production-grade Scope 3 analytics.

What's Covered?
Report Summary
Key Takeaways
1. USA market grows from ~$4.2B to ~$9.9B by 2030 (~18% CAGR); carbon accounting SaaS remains the revenue anchor.
2. Scope 3 analytics reach ~53% of large enterprises by 2030; network exchanges triple as data-sharing normalizes.
3. Supplier risk models blend disclosures, satellite/IoT, and adverse media; outputs tie directly to sourcing rules.
4. Audit readiness compresses to 6–8 weeks via standardized pipelines and vendor-managed evidence rooms.
5. Consulting/implementation holds ~18% share critical for ERP/PLM integration, data remediation, and supplier onboarding.
6. IoT/metering rises in energy-intense links (manufacturing, cold chain) to replace proxy factors with measured data.
7. Interoperability and chain-of-custody verification become top differentiators for enterprise buying teams.
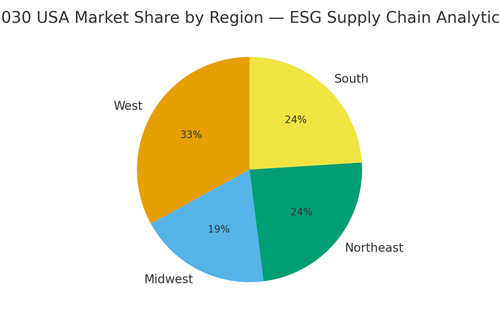
8. Regional spend led by the West; Northeast/South close behind; Midwest anchored by industrial modernization.
Key Metrics
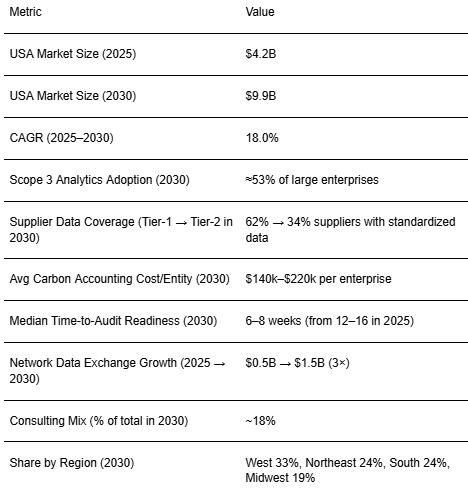
Market Size & Share
The U.S. ESG supply chain analytics market is modeled to expand from ~$4.2B in 2025 to ~$9.9B in 2030 (≈18% CAGR). Growth is concentrated in carbon accounting SaaS, supplier risk/ESG scoring, and network data exchanges. Adoption is propelled by investor demands for audited emissions and product-level footprints, lender risk models, and large buyers’ supplier code updates. Scope 3 visibility rises from ~24% to ~53% of large enterprises, underpinned by data pipelines that blend primary supplier activity data, category-level emission factors, and metered signals. A parallel trend is the normalization of product carbon footprints (PCFs) at SKU level, supported by chain-of-custody controls and sampling plans. IoT/metering expands selectively in energy-intense nodes to replace proxy models, while lifecycle databases act as scaffolding where direct measurement is impractical. The TAM also broadens as mid-market firms adopt lighter solutions and managed services. Risks include data privacy, supplier fatigue, and factor volatility; mitigations revolve around neutral exchanges, index-linked pricing, and programmatic onboarding.

Market Analysis
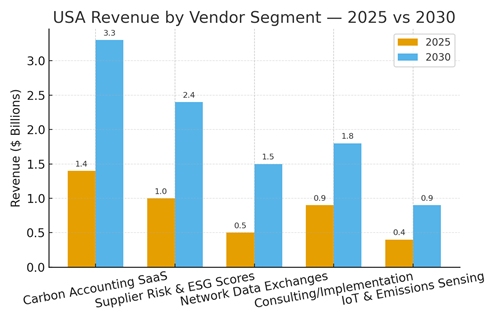
Revenue mix shifts meaningfully by 2030: carbon accounting SaaS grows from ~$1.4B to ~$3.3B; supplier risk & ESG scores from ~$1.0B to ~$2.4B; network data exchanges triple from ~$0.5B to ~$1.5B as standardized sharing and verification take hold. Consulting/implementation expands to ~$1.8B but declines as a share of total, indicating product maturation; IoT & emissions sensing more than doubles to ~$0.9B as measured data replaces proxies in key nodes. Buy-side priorities: verifiability (audit trails, sampling), interoperability (ERP/PLM/TMS/WMS connectors), and cost-to-serve (per-entity vs. footprint-based billing). Vendors differentiate via data rights frameworks, supplier incentives (credits, financing partners), and remediation playbooks. Consolidation themes: platforms acquiring specialized exchanges, consultancies building managed services around leading SaaS, and sensor/IoT firms partnering with software vendors for turnkey deployments.
Trends & Insights
Four trends dominate 2025–2030: (1) Product carbon footprints become a default artifact in RFPs and retailer portals; audit-grade methods, sampling, and chain of custody are codified. (2) Data exchanges mediate buyer–supplier data friction, using neutral governance and standardized attestations to raise coverage across Tiers 1–2. (3) Sensorization grows where measurement ROI beats modeling cold chains, metal fabrication, chemicals feeding continuous emissions monitoring into analytics. (4) Supplier risk models expand beyond climate to include labor, DEI, deforestation, and governance, with score outputs dictating sourcing levers and contract clauses. Enablement themes: supplier financing for retrofits, rebates tied to verifiable reductions, and playbooks for material/route substitution. Risk headwinds: model drift from emission factor updates, greenwashing penalties, and data privacy; mitigations include versioned factors, third-party audits, and secure enclaves.
Segment Analysis
By industry, consumer brands and tech lead spending on SKU-level PCFs and supplier engagement. Industrials and automotive prioritize IoT/metering and manufacturing process models, while retail and e-grocery invest in logistics analytics for lane-level footprints and refrigeration energy. Healthcare and pharma focus on compliant audit trails and supplier diligence; energy and chemicals adopt exchanges for feedstock traceability. By buyer size, large enterprises deploy multi-vendor stacks with exchanges; mid-market opts for SaaS + managed services. Supplier segments split between high-maturity (digitized ERPs, EDI/API-ready) and low-maturity tiers needing templates and portals. Winning vendors tailor onboarding kits, provide factor updates as a service, and include remediation guidance that links analytics to sourcing outcomes.
Geography Analysis
Regional spend skews to the West (~33%) on the strength of tech and consumer brand adoption and availability of skilled implementers. The Northeast (~24%) benefits from financial-sector governance and retail hubs; the South (~24%) sees strong logistics and manufacturing uptake; the Midwest (~19%) is propelled by industrial modernization programs. State incentives, utility rebates, and retailer mandates modulate adoption rates locally. Enterprises should stage rollouts by supplier density, incentives, and implementation capacity to minimize payback periods.
Competitive Landscape
Competition clusters around platforms (carbon accounting + PCF + Scope 3), specialist risk scorers, neutral data exchanges, consulting integrators, and IoT players. Convergence accelerates via M&A and partnerships: platforms acquire exchanges and factor libraries; consultancies wrap managed services around top SaaS; IoT firms integrate with analytics vendors to deliver turnkey measurement. Differentiators: audit-grade methods, data rights and privacy, embedded remediation workflows, and breadth of integrations. Buyers increasingly demand outcome-based pricing (coverage, % primary data, verified reductions) alongside per-entity tiers.
Report Details
Proceed To Buy
Want a More Customized Experience?
- Request a Customized Transcript: Submit your own questions or specify changes. We’ll conduct a new call with the industry expert, covering both the original and your additional questions. You’ll receive an updated report for a small fee over the standard price.
- Request a Direct Call with the Expert: If you prefer a live conversation, we can facilitate a call between you and the expert. After the call, you’ll get the full recording, a verbatim transcript, and continued platform access to query the content and more.
68 Circular Road, #02-01 049422, Singapore
Revenue Tower, Scbd, Jakarta 12190, Indonesia
4th Floor, Pinnacle Business Park, Andheri East, Mumbai, 400093
Cinnabar Hills, Embassy Golf Links Business Park, Bengaluru, Karnataka 560071
Request Custom Transcript
Related Transcripts

$ 1395


68 Circular Road, #02-01 049422, Singapore
Revenue Tower, Scbd, No.52-53, Jakarta 12190, Indonesia
Cinnabar Hills, Embassy Golf Links Business Park, Bengaluru, Karnataka 560071
4th Floor, Pinnacle Business Park, Andheri East, Mumbai, 400093


68 Circular Road, #02-01 049422, Singapore
Revenue Tower, Scbd, Jakarta 12190, Indonesia
4th Floor, Pinnacle Business Park, Andheri East, Mumbai, 400093
Cinnabar Hills, Embassy Golf Links Business Park, Bengaluru, Karnataka 560071