

68 Circular Road, #02-01 049422, Singapore
Revenue Tower, Scbd, Jakarta 12190, Indonesia
4th Floor, Pinnacle Business Park, Andheri East, Mumbai, 400093
Cinnabar Hills, Embassy Golf Links Business Park, Bengaluru, Karnataka 560071


Connect With Us


68 Circular Road, #02-01 049422, Singapore
Revenue Tower, Scbd, Jakarta 12190, Indonesia
4th Floor, Pinnacle Business Park, Andheri East, Mumbai, 400093
Cinnabar Hills, Embassy Golf Links Business Park, Bengaluru, Karnataka 560071
Connect With Us
68 Circular Road, #02-01 049422, Singapore
Revenue Tower, Scbd, Jakarta 12190, Indonesia
4th Floor, Pinnacle Business Park, Andheri East, Mumbai, 400093
Cinnabar Hills, Embassy Golf Links Business Park, Bengaluru, Karnataka 560071
Request Custom Transcript
Global Subscription Fatigue Solutions: Behavioral Economics & Tiered Value Proposition Design
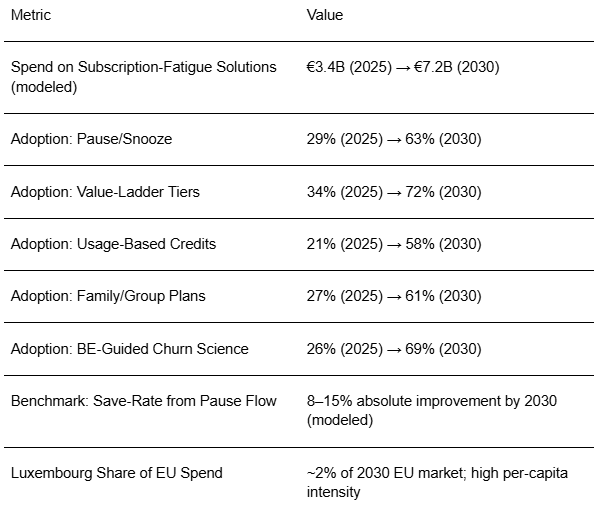
Subscription fatigue is the central retention challenge of the next cycle. From media and software to mobility and wellness, European consumers face an overhang of paid services, rising price sensitivity, and attention scarcity. The solution set is shifting from blunt discounting toward behavioral economics (BE)‑informed design and value‑tier engineering: pause/snooze options that prevent hard churn, value ladders that match willingness‑to‑pay with clear outcomes, and usage‑based credits that protect perceived fairness. We model Europe’s spend on “subscription fatigue solutions” a composite of retention science, experimentation platforms, offer management, and tier redesign rising from ~€3.4B in 2025 to ~€7.2B by 2030. Luxembourg, while a small share by volume, is notable on a per‑capita basis because of its high financial‑services and software penetration and cross‑border consumer flows. Operationally, leaders reframe retention as a product design problem. BE levers loss aversion framing, goal‑gradient progress bars, endowed trials, and choice architecture are embedded into journeys: upgrade prompts arrive when value is salient; pauses default to re‑activation; and exits present “keep core, shed extras” micro‑tiers.

What's Covered?
Report Summary
Key Takeaways
1. Retention is product design: embed BE levers throughout the journey, not just at billing events.
2. Pause/snooze reduces hard churn and preserves re‑activation; default paths matter.
3. Outcome‑based value ladders outperform feature lists; name tiers after jobs‑to‑be‑done.
4. Usage credits act as a fairness valve; prevent bill shock and sustain perceived value.
5. Family/group plans socially anchor subscriptions and lift multi‑seat retention.
6. Dashboards must be CFO‑credible: NRR, gross churn, save‑rate, re‑activation, margin after incentives.
7. Compliance and transparency are strategic advantages in EU markets.
8. Luxembourg punches above weight on per‑capita adoption; cross‑border UX is key.
Key Metrics
Market Size & Share
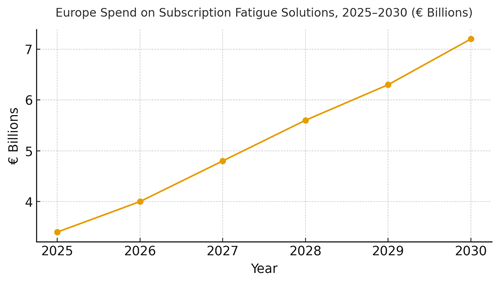
Europe’s spend on subscription‑fatigue solutions spanning retention analytics, experimentation platforms, offer management, and value‑tier redesign is modeled to rise from ~€3.4B in 2025 to ~€7.2B in 2030. Growth is driven by the maturation of subscription models beyond media/telecom into software, education, mobility, and wellness. As household subscription stacks thicken, downgrade and churn pressure grows; firms respond with BE‑informed design and tier engineering. The segment’s share within broader subscription operations budgets increases as CFOs redirect production discount budgets to evidence‑based save architectures. Luxembourg contributes a modest volume share (~2%) but higher per‑capita investment due to finance/software density and cross‑border consumer flows.
Share dynamics: larger EU markets (UK & Ireland, DACH, France) dominate spend, but adoption speed is notable in Benelux and Nordics. Vendors that combine journey experimentation, offer management, and billing orchestration capture outsized share. Value‑tier redesign projects spike during price changes and category expansions (e.g., adding premium support or family features). Measurement sophistication is the differentiator: organizations that quantify incremental save‑rate and re‑activation, and that treat pause as a strategic buffer rather than a hidden churn, gain share over time. The line chart shows the modeled growth trajectory for Europe through 2030.
Execution: standardize value propositions, codify jobs‑to‑be‑done per segment, and ensure pricing pages and in‑app modals reflect clear trade‑offs. Establish a save‑architecture backlog (pause, downgrade, micro‑tiers) with guardrails that protect margin while preserving perceived fairness.
Market Analysis
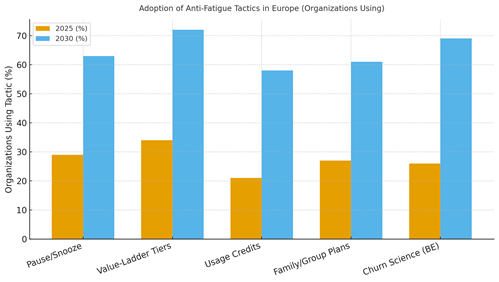
Adoption of anti‑fatigue tactics will broaden materially by 2030. We project pause/snooze usage at ~63% of European subscription businesses, value‑ladder tiers at ~72%, usage credits at ~58%, family/group plans at ~61%, and BE‑guided churn science programs at ~69%. Early gains come from pause/save flows that convert “at‑risk cancel” into “temporary break” with seeded re‑activation. Value ladders aligned to jobs‑to‑be‑done reduce confusion and anchor upgrades on outcomes, not features. Usage credits (carry‑over, bill‑shock protection) raise perceived fairness and reduce involuntary churn triggers. Family/group plans lower marginal churn via social anchoring and shared benefits.
Financial lens: shift from flat discounts to outcome‑based incentives tied to incremental margin. Track cost‑to‑save, re‑activation contribution, and post‑save lifetime value. Experimentation is essential: run holdouts for each intervention; measure downgrade vs. churn substitution; and optimize the sequence of offers (pause → micro‑tier → return). Vendor approach: modular stacks integrating experimentation, offer management, paywall, and billing enable faster iteration. The bar chart illustrates step‑changes in tactic adoption between 2025 and 2030. Execution risk centers on over‑complex tiering, opaque disclosures, and ungoverned incentives; mitigate with clear copy, caps, and regular portfolio audits.
Trends & Insights
1) Pause as a product: treated as a formal state with progress preservation, prompted re‑activation, and optional bill‑credit incentives. 2) Outcome‑based tiers: naming and packaging around jobs‑to‑be‑done; premium tiers add guarantees, service levels, or multi‑seat value. 3) Fairness engineering: usage credits, pro‑rations, and bill‑shock dampeners shift sentiment and reduce complaints. 4) Experimentation culture: weekly test cadence on pricing pages, modals, and save flows; quota for BE interventions (loss aversion, endowed progress). 5) Multi‑party subscriptions: family, team, and employer‑paid bundles anchor more than one decision‑maker, raising resilience. 6) Transparency edge: clear disclosures and cancellation UX reduce regulatory risk and increase trust often improving save‑rates paradoxically. 7) Collections & involuntary churn: dunning sequences redesigned with BE nudges and multi‑method payments. 8) Cross‑border UX (Luxembourg): multilingual copy, SEPA and local wallets, and VAT clarity. 9) AI‑assisted retention ops: propensity models rank save offers; copy assistants produce tier‑specific value statements with human QA. 10) Portfolio pruning: fewer, clearer tiers outperform sprawling menus.
Segment Analysis
Media/Entertainment: High fatigue risk; pause/save and micro‑tiers around ads‑light and offline features are effective. Software/SaaS: Outcome‑based tiers with SLAs, security, or collaboration unlocks; usage credits smooth seasonal dips. Telecom & Connectivity: Family plans and employer bundles; BE‑guided upgrade prompts at service milestones. Mobility/Transport: Credit banks and off‑peak rewards reduce churn during low‑usage months. Health & Wellness: Streaks, endowed progress, and freeze options; family add‑ons raise stickiness. Financial Services/Insurtech: Tiered advice, priority support, and statement‑linked rewards; high compliance bar. Education & Learning: Semester‑aligned bundles; pause during breaks; credits for course completions. Across segments, define “core vs extra” to support dignified downgrades. Measure: per‑segment save‑rate, re‑activation interval, downgrade→upgrade rivers, and margin after incentives. Luxembourg’s finance/software mix favors SaaS‑style tiers and employer bundles; cross‑border commuters benefit from family/team constructs with VAT clarity and multilingual support.
Geography Analysis
By 2030, we model Europe’s spend on fatigue solutions distributed across major sub‑regions with the UK & Ireland and DACH leading aggregate volume, followed by France and Southern Europe; Nordics and Benelux contribute disproportionately high per‑capita adoption. Luxembourg’s absolute share is small (~2%) yet its per‑capita intensity is among the highest due to finance/software concentration and cross‑border consumer flows. Policy environments favor transparent pricing, simple cancellations, and data minimization making clarity a competitive advantage.
Localization: DACH emphasizes compliance clarity and invoice‑grade receipts; France prioritizes consumer rights copy; Nordics adopt credits and family plans quickly; Southern Europe blends affordability with employer bundles; Benelux favors experimentation and modular stacks. Luxembourg requires multilingual (FR/DE/LU/EN) interfaces, SEPA and wallet support, and VAT‑clean invoicing. For cross‑border shoppers, present tier parity and tax handling upfront. The pie chart highlights Europe’s 2030 spend split with Luxembourg called out explicitly.
Execution: centralize experimentation and value‑prop libraries; allow regional teams to tune copy, payment methods, and perks. Monitor region‑specific KPIs: save‑rate, re‑activation, and complaints per 10k bills; use these to prioritize backlog and budget allocation.

Competitive Landscape
Vendors cluster into experimentation platforms, offer/promo management, paywall & pricing pages, billing & payments, and retention analytics. Incumbents with billing depth partner with BE‑aware experimentation tools; challengers differentiate on speed and copy/testing UX. Moats: (1) measurement credibility (holdouts, intent matching), (2) orchestration breadth (offers + billing + dunning), (3) compliance and transparency tooling, and (4) time‑to‑launch for tier redesigns. Buyers should avoid lock‑in by insisting on modular contracts and data portability. Competitive KPIs: cost‑to‑save, incremental NRR, re‑activation contribution, and margin after incentives. Quarterly portfolio audits should prune underperforming tiers and cap incentive drift. In Luxembourg, vendors that support multilingual flows, SEPA rails, and cross‑border tax logic win disproportionate share. The winners of 2025–2030 will be those that make BE‑informed retention mechanics operable at scale with clean disclosures and CFO‑grade attribution.
Report Details
Proceed To Buy
Want a More Customized Experience?
- Request a Customized Transcript: Submit your own questions or specify changes. We’ll conduct a new call with the industry expert, covering both the original and your additional questions. You’ll receive an updated report for a small fee over the standard price.
- Request a Direct Call with the Expert: If you prefer a live conversation, we can facilitate a call between you and the expert. After the call, you’ll get the full recording, a verbatim transcript, and continued platform access to query the content and more.
68 Circular Road, #02-01 049422, Singapore
Revenue Tower, Scbd, Jakarta 12190, Indonesia
4th Floor, Pinnacle Business Park, Andheri East, Mumbai, 400093
Cinnabar Hills, Embassy Golf Links Business Park, Bengaluru, Karnataka 560071
Request Custom Transcript
Related Transcripts

$ 1395


68 Circular Road, #02-01 049422, Singapore
Revenue Tower, Scbd, No.52-53, Jakarta 12190, Indonesia
Cinnabar Hills, Embassy Golf Links Business Park, Bengaluru, Karnataka 560071
4th Floor, Pinnacle Business Park, Andheri East, Mumbai, 400093


68 Circular Road, #02-01 049422, Singapore
Revenue Tower, Scbd, Jakarta 12190, Indonesia
4th Floor, Pinnacle Business Park, Andheri East, Mumbai, 400093
Cinnabar Hills, Embassy Golf Links Business Park, Bengaluru, Karnataka 560071