

68 Circular Road, #02-01 049422, Singapore
Revenue Tower, Scbd, Jakarta 12190, Indonesia
4th Floor, Pinnacle Business Park, Andheri East, Mumbai, 400093
Cinnabar Hills, Embassy Golf Links Business Park, Bengaluru, Karnataka 560071


Connect With Us


68 Circular Road, #02-01 049422, Singapore
Revenue Tower, Scbd, Jakarta 12190, Indonesia
4th Floor, Pinnacle Business Park, Andheri East, Mumbai, 400093
Cinnabar Hills, Embassy Golf Links Business Park, Bengaluru, Karnataka 560071
Connect With Us
68 Circular Road, #02-01 049422, Singapore
Revenue Tower, Scbd, Jakarta 12190, Indonesia
4th Floor, Pinnacle Business Park, Andheri East, Mumbai, 400093
Cinnabar Hills, Embassy Golf Links Business Park, Bengaluru, Karnataka 560071
Request Custom Transcript
Reverse Logistics Automation: Cost Reduction Strategies & Sustainability Metrics for E-Commerce Returns
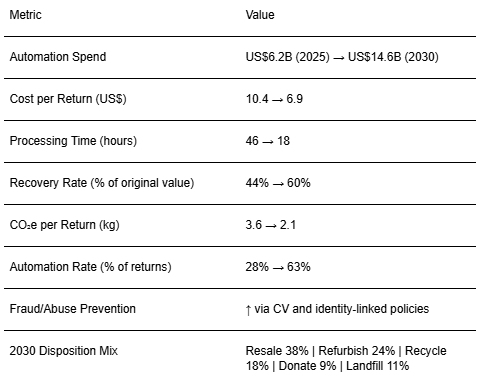
Returns are now a strategic P&L lever. From 2025 to 2030, North American retailers automate reverse logistics to compress cost per return, speed triage, and raise value recovery while reporting credible sustainability metrics for regulators and customers. We model reverse‑logistics automation spend rising from ~US$6.2B (2025) to ~US$14.6B (2030). Value is captured through robotic induction/sortation, computer‑vision grading, rules‑driven disposition, and dynamic routing to resale, refurbish, recycle, or donate streams. Cost mechanics: automated induction and CV grading shorten processing time from ~46 hours to ~18 hours median, lowering cost per return from ~US$10.4 to ~US$6.9 by 2030. Recovery rate (share of original value) rises from ~44% to ~60% as items are routed faster to the best market (own outlet, marketplaces, B2B liquidators) with condition‑based pricing. Automation coverage expands from ~28% to ~63% of returns, concentrating labor on exception handling. Sustainability outcomes: CO₂e per return drops from ~3.6 kg to ~2.1 kg through consolidation logic, packaging right‑sizing, and first‑mile avoidance (at‑home pickup lockers). Disposition mix shifts toward resale (~38%), refurbish (~24%), and recycle (~18%), with landfill falling to ~11%.
What's Covered?
Report Summary
Key Takeaways
1. Automation compresses cost and time; exceptions get human focus.
2. Computer‑vision grading and serial capture unlock higher recovery rates.
3. Dynamic routing optimizes between value, fees, and emissions.
4. Packaging right‑sizing and consolidation cut CO₂e per return materially.
5. Fraud controls (CV + identity) reduce wardrobing and false claims.
6. Circularity goals: push resale/refurbish; keep landfill under ~11%.
7. Orchestration across WMS/TMS/marketplaces/repair partners is essential.
8. CFO dashboard: cost/return, hours, recovery %, CO₂e/return, automation %, fraud rate.
Key Metrics
Market Size & Share
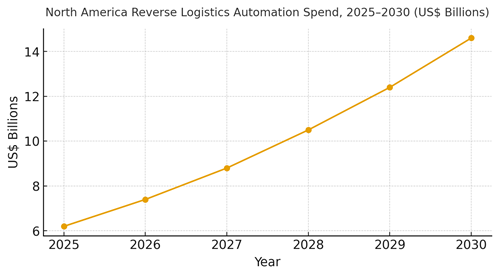
North American reverse logistics automation spend is modeled to grow from ~US$6.2B (2025) to ~US$14.6B (2030). Value pools concentrate in high‑return verticals apparel, footwear, electronics, and home goods where condition variance and resale/refurbish options are rich. The line figure charts this trajectory. Share accrues to operators with dense node networks, strong resale partnerships, and repair/refurb capacity. Risks: hazmat flows (lithium‑ion), peak surges, and mismatched grading standards across partners.
Execution priorities: standardize grading across categories; enforce serial capture for electronics; and secure regional partners for refurbish and recycling to lower transport emissions. Measure share via processed volume, recovery dollars, and successful first‑touch disposition rates.
Market Analysis
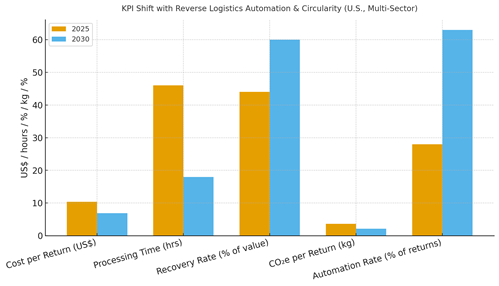
Automation reshapes unit economics. We model cost per return dropping from ~US$10.4 to ~US$6.9 as processing time falls from ~46 to ~18 hours; recovery rate increases from ~44% to ~60% with CV grading and smarter routing; CO₂e per return declines from ~3.6 to ~2.1 kg with consolidation and right‑sizing; and automation rate rises from ~28% to ~63% by 2030. Enablers: robotic induction/sortation, CV grading, RFID/IMEI capture, and orchestration engines that route to marketplaces, refurb, or recycling based on price and carbon. Barriers: data gaps, repair capacity, and inconsistent partner SLAs.
Financial lens: attribute to incremental margin net of transport, fees, and refurb costs; run node‑level holdouts; and monitor secondary‑market yield by grade. The bar chart summarizes directional KPI improvements under disciplined automation and circularity operations.
Trends & Insights
1) Computer‑vision and serial capture mainstream grading and fraud control. 2) Dynamic routing engines weigh recovery $ vs CO₂e to pick the best path. 3) Locker drop‑offs and pickup points shrink first‑mile emissions. 4) Packaging right‑sizing and reusable mailers cut materials and DIM weight. 5) On‑platform resale and buy‑back programs integrate with loyalty. 6) Battery and e‑waste compliance drives certified reverse flows. 7) Circularity dashboards move from marketing to audited KPIs. 8) Automation‑friendly packaging becomes a supplier requirement. 9) Insurance and warranty tie‑ins increase refurb conversion. 10) Sustainability-linked financing rewards diversion from landfill.
Segment Analysis
Apparel & Footwear: High volume; CV sizing/defect detection; resale and outlet streams. Electronics: IMEI/serial capture; battery SOPs; refurb labs; marketplace resale. Home Goods: Bulky returns; repair vs part‑out decisions; local recyclers. General E‑commerce: Mixed carts; rule‑based triage and consolidation. Across segments, define grading rubrics, fraud flags, partner SLAs, and CO₂e thresholds; track cost/return, processing time, recovery %, and emissions per return by category and node.
Geography Analysis (≈300 words)
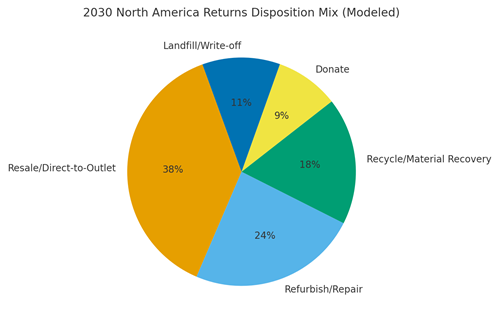
Disposition mix varies by region and infrastructure. By 2030, North America returns disposition is modeled as Resale/Direct‑to‑Outlet (~38%), Refurbish/Repair (~24%), Recycle/Material Recovery (~18%), Donate (~9%), and Landfill/Write‑off (~11%). Dense metro nodes favor resale/refurbish due to short haul distances and buyer density; rural nodes lean on recycle/donate. The pie figure reflects the modeled mix.
Execution: place refurb labs and recycling partners near return hubs; contract local donation networks; and use emissions‑aware routing to minimize transport. Measure region‑specific recovery dollars, CO₂e/return, and landfill diversion %; rebalance capacity quarterly.
Competitive Landscape
Incumbent 3PLs integrate automation and resale exchanges; marketplaces add certified refurb programs; niche recyclers scale e‑waste and textiles. Differentiation vectors: (1) grading accuracy and fraud detection, (2) orchestration depth across resale/refurb/recycle partners, (3) repair capacity and turnaround, (4) emissions‑aware routing and reporting, and (5) SLA transparency. Procurement guidance: demand open APIs, serial/IMEI capture, certified recycling, and audited CO₂e/circularity reporting. Competitive KPIs: cost/return, processing time, recovery %, CO₂e/return, automation %, fraud rate, and landfill diversion %.
Report Details
Proceed To Buy
Want a More Customized Experience?
- Request a Customized Transcript: Submit your own questions or specify changes. We’ll conduct a new call with the industry expert, covering both the original and your additional questions. You’ll receive an updated report for a small fee over the standard price.
- Request a Direct Call with the Expert: If you prefer a live conversation, we can facilitate a call between you and the expert. After the call, you’ll get the full recording, a verbatim transcript, and continued platform access to query the content and more.
68 Circular Road, #02-01 049422, Singapore
Revenue Tower, Scbd, Jakarta 12190, Indonesia
4th Floor, Pinnacle Business Park, Andheri East, Mumbai, 400093
Cinnabar Hills, Embassy Golf Links Business Park, Bengaluru, Karnataka 560071
Request Custom Transcript
Related Transcripts


68 Circular Road, #02-01 049422, Singapore
Revenue Tower, Scbd, No.52-53, Jakarta 12190, Indonesia
Cinnabar Hills, Embassy Golf Links Business Park, Bengaluru, Karnataka 560071
4th Floor, Pinnacle Business Park, Andheri East, Mumbai, 400093


68 Circular Road, #02-01 049422, Singapore
Revenue Tower, Scbd, Jakarta 12190, Indonesia
4th Floor, Pinnacle Business Park, Andheri East, Mumbai, 400093
Cinnabar Hills, Embassy Golf Links Business Park, Bengaluru, Karnataka 560071