

68 Circular Road, #02-01 049422, Singapore
Revenue Tower, Scbd, Jakarta 12190, Indonesia
4th Floor, Pinnacle Business Park, Andheri East, Mumbai, 400093
Cinnabar Hills, Embassy Golf Links Business Park, Bengaluru, Karnataka 560071


Connect With Us


68 Circular Road, #02-01 049422, Singapore
Revenue Tower, Scbd, Jakarta 12190, Indonesia
4th Floor, Pinnacle Business Park, Andheri East, Mumbai, 400093
Cinnabar Hills, Embassy Golf Links Business Park, Bengaluru, Karnataka 560071
Connect With Us
68 Circular Road, #02-01 049422, Singapore
Revenue Tower, Scbd, Jakarta 12190, Indonesia
4th Floor, Pinnacle Business Park, Andheri East, Mumbai, 400093
Cinnabar Hills, Embassy Golf Links Business Park, Bengaluru, Karnataka 560071
Request Custom Transcript
Retail Media Network (RMN) Attribution Models: Closed-Loop Measurement & Cross-Channel ROI Optimization
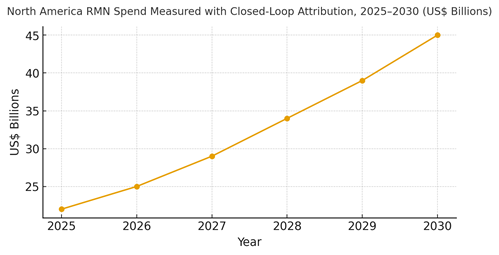
Retail Media Networks are evolving from last‑click walled gardens to accountable, cross‑channel performance platforms. Between 2025 and 2030, North American RMNs standardize privacy‑safe identity, link on‑ and off‑property exposures to verified conversions (in‑store and online), and expose experiment‑ready interfaces for incrementality. We model closed‑loop measured RMN spend rising from ~US$22B in 2025 to ~US$45B in 2030 as advertisers shift budgets toward attributable outcomes and retailers monetize authenticated audiences. The new attribution stack is layered. (1) Identity: consented shopper graphs with device and household resolution; clean rooms for partner data. (2) Measurement: randomized controlled trials (geo/household‑level) and calibrated MMM/MTA hybrids for always‑on reading. (3) Optimization: portfolio allocation across onsite search/display, offsite programmatic, CTV/video, and in‑store screens; constraints include frequency, category adjacency, and shelf availability. (4) Governance: deduplication logic, lookback windows, and audit trails for brand safety and privacy.
What's Covered?
Report Summary
Key Takeaways
1. Incrementality over attribution: holdouts first, models second.
2. Identity quality drives ROI; match rate and household resolution matter.
3. Deduplicate across RMNs and channels to avoid proximity credit.
4. Connect ads to shelf: suppress OOS, cap frequency, and enforce adjacency rules.
5. Measure offline lift via geo/HH RCTs; use MMM/MTA hybrids for scale.
6. Optimize at the portfolio level: onsite, offsite, CTV, and in‑store screens.
7. Clean rooms and audit trails protect privacy and enable collaboration.
8. CFO dashboard: incremental ROAS, match rate, lag, offline coverage, dedupe %, and waste.
Key Metrics

Market Size & Share
Closed‑loop measured RMN spend in North America is modeled to grow from ~US$22B in 2025 to ~US$45B by 2030 as identity and experimentation mature. Retailers with authenticated traffic, strong in‑store networks, and clean‑room partnerships will capture share. The line figure shows the compounded trajectory.
Share dynamics inside the stack: identity graphs and consent UX; clean‑room connectivity; exposure logs with impression‑level transparency; and measurement/optimization services. Winners productize experiments (geo/household RCTs), maintain privacy‑safe deduplication, and link ads to on‑shelf availability to reduce waste. Execution risks: fragmented standards, signal loss, and inventory blind spots.
Market Analysis
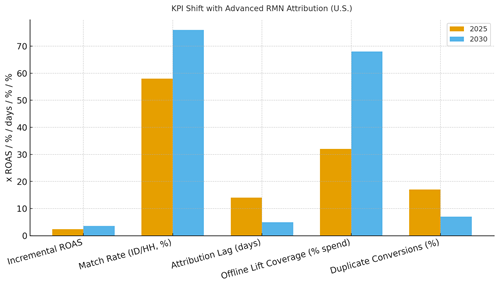
Advanced attribution changes both speed and accuracy. We model incremental ROAS rising from ~2.4x to ~3.6x as match rates climb and lag compresses; duplicate conversions fall with cross‑RMN dedupe; and offline lift coverage expands via standardized geo/household RCTs. Enablers: privacy‑safe IDs, clean rooms, impression logs, OOS suppression, and MMM/MTA hybrids. Barriers: siloed RMN taxonomies, creative inconsistency, and inventory gaps.
Financial lens: read attribution alongside contribution margin and supply chain costs; validate with holdouts and matched markets; and use portfolio optimization to allocate spend across onsite, offsite, CTV, and in‑store. The bar chart summarizes directional KPI improvements.
Trends & Insights
1) Holdout‑first culture: permanent control groups normalize true incrementality. 2) ID interoperability: retailer graphs handshake via clean rooms and modeled reach. 3) Shelf‑aware delivery: inventory and price signals suppress waste. 4) MMM↔MTA fusion: MMM guides tops‑down budgets; MTA refines tactics; both calibrated by RCTs. 5) Creative/format testing: DCO for onsite, shoppable CTV for video, and dynamic slots in‑store. 6) Attention and viewability: quality screens beat impressions. 7) Privacy‑safe collaboration: minimal‑movement joins and auditable code. 8) Retail media for brand and performance: unified scorecards cover reach, lift, and margin. 9) Converged buying: RMN inventory joins CTV and programmatic pipes. 10) Talent: experimentation product managers and econometricians embedded with media ops.
Segment Analysis
CPG/Food & Bev: High offline share prioritize in‑store screens and geo RCTs. Beauty: Onsite search/display with sampling and loyalty tie‑ins. Electronics: Offsite and CTV drive reach; onsite closes. Pharma/OTC: Compliance‑sensitive; proximity and adjacency rules. Home & DIY: Seasonality with high‑ticket consideration—CTV plus onsite guides. Quick‑serve/Restaurants: RMN audiences for local demand; tight OOS suppression. Across segments, define adjacency, frequency caps, holdout sizes, and inventory links; track incremental ROAS, lag, dedupe %, and offline coverage.
Geography Analysis
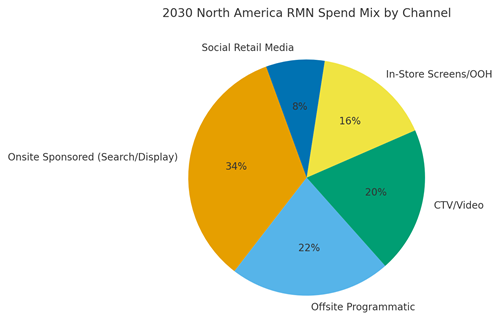
By 2030, channel mix for North America RMN spend is modeled as Onsite Sponsored (~34%), Offsite Programmatic (~22%), CTV/Video (~20%), In‑Store Screens/OOH (~16%), and Social Retail Media (~8%). Coastal metros scale CTV/in‑store earlier due to inventory and footfall; suburban regions rely more on onsite search and offsite retargeting. The pie figure reflects the channel mix.
Execution: centralize identity and experiment design; allow regions to adjust channel weights by store density, category mix, and inventory reliability. Measure geography‑specific incremental ROAS, match rate, lag, and dedupe %; rebalance budgets quarterly.
Competitive Landscape
Incumbent RMNs deepen clean‑room ties and add impression‑level logs; converged TV/CTV platforms bundle shoppable inventory; programmatic partners offer cross‑RMN deduplication. Differentiation vectors: (1) identity scale and quality, (2) experiment‑as‑a‑product, (3) shelf‑aware delivery, (4) impression transparency with audit trails, and (5) portfolio optimization tooling. Procurement guidance: require open APIs, log‑level data access under clean‑room controls, dedupe methodology disclosure, and holdout enforcement. Competitive KPIs: incremental ROAS, match rate, lag, dedupe %, offline coverage, and cost per verified conversion.
Report Details
Proceed To Buy
Want a More Customized Experience?
- Request a Customized Transcript: Submit your own questions or specify changes. We’ll conduct a new call with the industry expert, covering both the original and your additional questions. You’ll receive an updated report for a small fee over the standard price.
- Request a Direct Call with the Expert: If you prefer a live conversation, we can facilitate a call between you and the expert. After the call, you’ll get the full recording, a verbatim transcript, and continued platform access to query the content and more.
68 Circular Road, #02-01 049422, Singapore
Revenue Tower, Scbd, Jakarta 12190, Indonesia
4th Floor, Pinnacle Business Park, Andheri East, Mumbai, 400093
Cinnabar Hills, Embassy Golf Links Business Park, Bengaluru, Karnataka 560071
Request Custom Transcript
Related Transcripts


68 Circular Road, #02-01 049422, Singapore
Revenue Tower, Scbd, No.52-53, Jakarta 12190, Indonesia
Cinnabar Hills, Embassy Golf Links Business Park, Bengaluru, Karnataka 560071
4th Floor, Pinnacle Business Park, Andheri East, Mumbai, 400093


68 Circular Road, #02-01 049422, Singapore
Revenue Tower, Scbd, Jakarta 12190, Indonesia
4th Floor, Pinnacle Business Park, Andheri East, Mumbai, 400093
Cinnabar Hills, Embassy Golf Links Business Park, Bengaluru, Karnataka 560071