

68 Circular Road, #02-01 049422, Singapore
Revenue Tower, Scbd, Jakarta 12190, Indonesia
4th Floor, Pinnacle Business Park, Andheri East, Mumbai, 400093
Cinnabar Hills, Embassy Golf Links Business Park, Bengaluru, Karnataka 560071


Connect With Us


68 Circular Road, #02-01 049422, Singapore
Revenue Tower, Scbd, Jakarta 12190, Indonesia
4th Floor, Pinnacle Business Park, Andheri East, Mumbai, 400093
Cinnabar Hills, Embassy Golf Links Business Park, Bengaluru, Karnataka 560071
Connect With Us
68 Circular Road, #02-01 049422, Singapore
Revenue Tower, Scbd, Jakarta 12190, Indonesia
4th Floor, Pinnacle Business Park, Andheri East, Mumbai, 400093
Cinnabar Hills, Embassy Golf Links Business Park, Bengaluru, Karnataka 560071
Request Custom Transcript
Retail as a Service (RaaS) Ecosystem Design: Multi-Brand Curation & Shared Infrastructure Economics
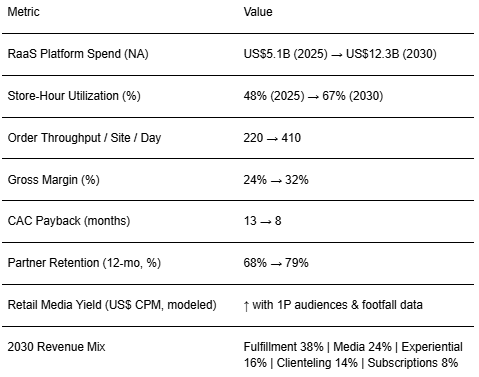
Retail as a Service (RaaS) turns underutilized stores, staff, data, and media into a platform others can rent. From 2025 to 2030, U.S. operators evolve from one‑brand networks to curated, multi‑brand ecosystems that monetize shared infrastructure fulfillment bays, clienteling apps, retail media, and event spaces while giving emerging brands turnkey access to scale. We model North America RaaS platform spend rising from ~US$5.1B (2025) to ~US$12.3B by 2030. Value is created by lifting store‑hour utilization, pushing more orders per site per day, expanding retail media yield, and compressing CAC payback for participating brands. The operating model has four loops. (1) Curation: category‑aware onboarding and performance SLAs keep the mix coherent and profitable. (2) Orchestration: OMS/WMS/clienteling unify inventory, appointments, services, and pop‑ups; capacity‑aware pricing sets the right fees. (3) Monetization: fulfillment fees, retail media, subscriptions, and services (alterations, consultations) diversify revenue. (4) Quality & trust: NPS, returns, and service SLAs safeguard ecosystem reputation. Done well, median programs can raise store‑hour utilization from ~48% to ~67%, throughput from ~220 to ~410 orders per site per day, gross margin from ~24% to ~32%, and partner retention from ~68% to ~79% by 2030 while compressing CAC payback from ~13 to ~8 months.
What's Covered?
Report Summary
Key Takeaways
1. Treat stores and staff as a shared platform sell capacity, not just inventory.
2. Curate multi‑brand mixes with SLAs; coherence beats sheer SKU count.
3. Price capacity dynamically (bays, associates, media impressions) to lift yield.
4. Retail media + 1P audiences monetize attention without heavy discounts.
5. Subscriptions and services smooth revenue and deepen relationships.
6. Data separation and fair ranking protect trust; audit algorithms regularly.
7. Operational excellence: OMS/WMS/clienteling integration and SLA dashboards.
8. CFO dashboard: utilization %, throughput, margin %, CAC payback, retention %.
Key Metrics
Market Size & Share
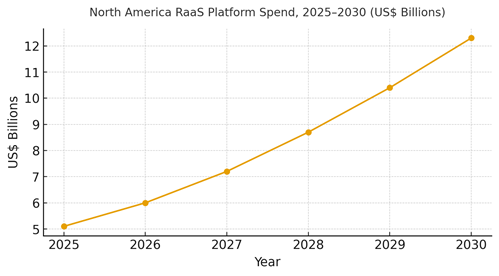
North American RaaS platform spend is modeled to grow from ~US$5.1B in 2025 to ~US$12.3B in 2030. Value pools concentrate where store networks, first‑party audiences, and fulfillment capabilities intersect. Host retailers win by opening their infrastructure inventory visibility, pick‑pack bays, appointments, and retail media to curated partners. The line figure shows the compounded trajectory.
Share dynamics: fulfillment‑led models dominate early with BOPIS and ship‑from‑store capacity; media and data products scale as audience graphs mature; subscriptions and services smooth seasonality. Execution risks include partner mis‑fit and capacity shocks; mitigations are rigorous onboarding, simulation‑based capacity planning, and variable pricing for bays and media.
Market Analysis
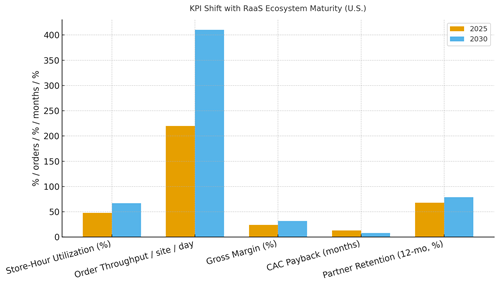
As ecosystems mature, KPIs shift in concert. We model store‑hour utilization rising from ~48% to ~67%, daily order throughput from ~220 to ~410 per site, gross margin from ~24% to ~32%, CAC payback compressing from ~13 to ~8 months, and 12‑month partner retention from ~68% to ~79% by 2030. Enablers: OMS/WMS/clienteling integration, capacity‑aware pricing, SLA dashboards, and retail media that leverages authenticated traffic. Barriers: integration debt, channel conflict, and privacy skepticism.
Financial lens: allocate shared costs by activity‑based costing; attribute media revenue net of discounts; and run geography/cohort holdouts for RaaS launches. The bar chart summarizes directional KPI improvements under disciplined ecosystem design.
Trends & Insights
1) Capacity as a product: bookable bays, appointments, and media with dynamic pricing. 2) Curation over aggregation: fewer, better partners with SLAs. 3) Retail media flywheel: authenticated traffic + offline conversion closes the loop. 4) Service catalogs: alterations/repairs/consults turn stores into membership hubs. 5) Privacy‑safe data products: clean rooms and modeled audiences. 6) Pop‑up factories: fast setup/teardown playbooks. 7) Labor design: multiskilled associates and scheduling against demand. 8) Interoperable contracts and revenue shares. 9) Sustainability: higher utilization lowers footprint per order. 10) CFO‑grade attribution: utilization, throughput, margin, CAC payback, and partner retention.
Segment Analysis
Grocery/Mass: Fulfillment‑heavy RaaS with high order density; retail media attracts CPG budgets. Specialty Apparel: Pop‑ups and clienteling services; repairs/alterations monetize visits. Beauty: Sampling bars and service subscriptions; creator collaborations. Electronics: Appointments and concierge services; high‑value retail media. Home & DIY: Project clinics and tool rental; curbside orchestration. Across segments, define partner criteria, fee/revenue shares, and SLA packages; track utilization, throughput, margin %, CAC payback, and retention by segment.
Geography Analysis
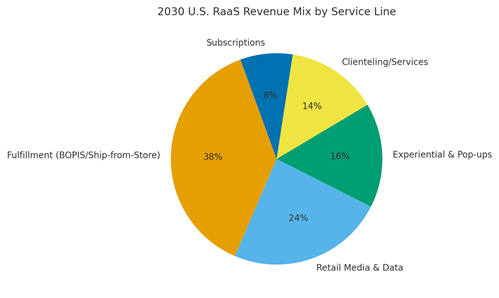
By 2030, U.S. RaaS revenue mix is modeled as Fulfillment (~38%), Retail Media & Data (~24%), Experiential & Pop‑ups (~16%), Clienteling/Services (~14%), and Subscriptions (~8%). Coastal metros ramp media and experiential revenue first; suburban hubs scale fulfillment; university towns and tourist corridors favor pop‑ups. The pie figure reflects service‑line mix.
Execution: centralize orchestration and pricing; allow regions to adjust partner mix and catalogs. Measure geography‑specific utilization, throughput, retention, and CAC payback; expand where unit economics exceed hurdle rates.
Competitive Landscape
Incumbent retailers open their networks; logistics platforms and retail media networks converge on RaaS; mall operators reposition as experience platforms. Differentiation vectors: (1) capacity density and reliability, (2) integration depth (OMS/WMS/clienteling), (3) privacy‑safe audience scale, (4) curation and brand fit, and (5) clear, auditable SLAs. Procurement guidance: require open APIs, clean‑room options, algorithmic audit trails, and champion‑challenger tests. Competitive KPIs: utilization %, throughput, margin %, CAC payback, partner retention, and media ROAS.
Report Details
Proceed To Buy
Want a More Customized Experience?
- Request a Customized Transcript: Submit your own questions or specify changes. We’ll conduct a new call with the industry expert, covering both the original and your additional questions. You’ll receive an updated report for a small fee over the standard price.
- Request a Direct Call with the Expert: If you prefer a live conversation, we can facilitate a call between you and the expert. After the call, you’ll get the full recording, a verbatim transcript, and continued platform access to query the content and more.
68 Circular Road, #02-01 049422, Singapore
Revenue Tower, Scbd, Jakarta 12190, Indonesia
4th Floor, Pinnacle Business Park, Andheri East, Mumbai, 400093
Cinnabar Hills, Embassy Golf Links Business Park, Bengaluru, Karnataka 560071
Request Custom Transcript
Related Transcripts

$ 1395


68 Circular Road, #02-01 049422, Singapore
Revenue Tower, Scbd, No.52-53, Jakarta 12190, Indonesia
Cinnabar Hills, Embassy Golf Links Business Park, Bengaluru, Karnataka 560071
4th Floor, Pinnacle Business Park, Andheri East, Mumbai, 400093


68 Circular Road, #02-01 049422, Singapore
Revenue Tower, Scbd, Jakarta 12190, Indonesia
4th Floor, Pinnacle Business Park, Andheri East, Mumbai, 400093
Cinnabar Hills, Embassy Golf Links Business Park, Bengaluru, Karnataka 560071