

68 Circular Road, #02-01 049422, Singapore
Revenue Tower, Scbd, Jakarta 12190, Indonesia
4th Floor, Pinnacle Business Park, Andheri East, Mumbai, 400093
Cinnabar Hills, Embassy Golf Links Business Park, Bengaluru, Karnataka 560071


Connect With Us


68 Circular Road, #02-01 049422, Singapore
Revenue Tower, Scbd, Jakarta 12190, Indonesia
4th Floor, Pinnacle Business Park, Andheri East, Mumbai, 400093
Cinnabar Hills, Embassy Golf Links Business Park, Bengaluru, Karnataka 560071
Connect With Us
68 Circular Road, #02-01 049422, Singapore
Revenue Tower, Scbd, Jakarta 12190, Indonesia
4th Floor, Pinnacle Business Park, Andheri East, Mumbai, 400093
Cinnabar Hills, Embassy Golf Links Business Park, Bengaluru, Karnataka 560071
Request Custom Transcript
Quantum Computing in Retail Pricing: Dynamic Algorithm Design & Customer Elasticity Modeling
Quantum computing is entering retail pricing as an accelerator not a replacement for advanced optimization. Between 2025 and 2030, U.S. leaders combine classical ML (demand forecasting, elasticity estimation) with quantum‑assisted solvers for combinatorial pricing and promotion decisions across millions of SKUs and constraints. We model North America spend on quantum‑enabled pricing and optimization growing from ~US$1.3B (2025) to ~US$4.6B (2030), with early adoption concentrated in grocery/mass, electronics, and home/DIY where price interaction effects and inventory constraints are dense. The design pattern is hybrid. Elasticities are estimated with classical econometrics and deep learning, then embedded in a mixed‑integer program (MIP) that respects guardrails (price ladders, MAP, vendor funding, competitor reactions, and fairness). Quantum methods QAOA/annealing‑style or quantum‑inspired heuristics speed the search for near‑optimal price/promotions under tight time windows. The outcome: faster solve times, more frequent refresh, lower promo cannibalization, and higher gross margin per unit sold without eroding customer trust.
What's Covered?
Report Summary
Key Takeaways
1. Hybrid is default: classical ML for elasticity; quantum‑assisted search for pricing MIP speed.
2. Refresh more often: faster solves enable near‑real‑time price and promo updates.
3. Guardrails first: ladders, MAP, fairness constraints, and fail‑open policies.
4. Cannibalization control: optimize baskets, not SKUs; limit halo erosion.
5. Shock‑aware priors: handle stockouts, weather, and promo seasonality.
6. Cost discipline: compare quantum‑as‑a‑service vs classical scaling economics.
7. Explain ability: price change reasons communicated to customers and regulators.
8. CFO dashboard: solve time, margin bps, cannibalization %, MAPE, refresh cadence.
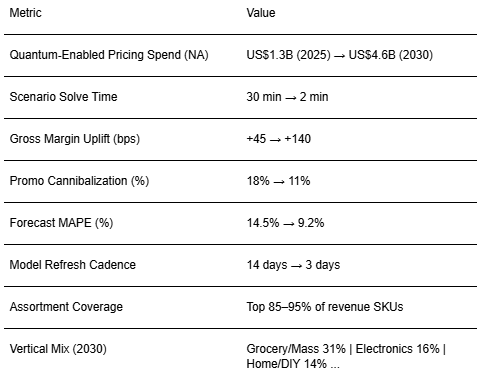
Key Metrics
Market Size & Share
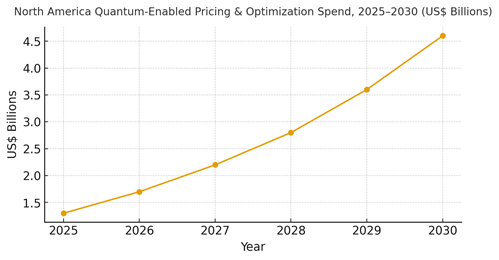
North American spend on quantum‑enabled pricing and retail optimization is modeled to grow from ~US$1.3B in 2025 to ~US$4.6B by 2030 as retailers seek speed and scale for combinatorial pricing problems. Adoption begins in categories with dense price interactions (grocery/mass, electronics, home/DIY) and flows with time pressure (markdown, promo mix, price zones). The line figure charts the growth trajectory.
Share dynamics within the stack: (1) data and feature pipelines, (2) elasticity/causal models, (3) optimization orchestration (MIP/heuristics), and (4) quantum back‑ends/quantum‑inspired solvers. Share accrues to players that control data quality, embed guardrails, and deliver explainable outcomes. Risks include hardware bottlenecks and vendor lock‑in; mitigations: abstraction layers that can swap back‑ends and champion‑challenger routing.
Market Analysis
Quantum‑assisted pricing changes the feasible frontier: more constraints, bigger baskets, faster refresh. We model solve time falling from ~1800s to ~120s for typical scenarios; model refresh cadence tightening from ~14 to ~3 days; gross margin uplift rising from ~+45 bps to ~+140 bps; promo cannibalization declining from ~18% to ~11%; and forecast MAPE improving from ~14.5% to ~9.2% as faster loops reveal truer demand response. Enablers: clean telemetry, elasticity libraries, and orchestration that can route between classical and quantum‑assisted solvers based on SLA. Barriers: cost of experiments, data drift, and change management in pricing teams.
Financial lens: compare quantum‑as‑a‑service costs vs classical compute at required SLAs; attribute value to incremental margin net of promo funding; and use store/zone holdouts to validate causality. The bar chart summarizes directional KPI improvements under disciplined operations.

Trends & Insights
1) Hybrid optimization: classical MIP + quantum‑assisted search for speed/scale. 2) Causal elasticities: uplift models supersede naive price regression. 3) Price fairness and explain ability: regulators and customers expect reasons. 4) Promo as portfolio: cannibalization and halo managed across categories. 5) Shock‑aware priors: inventory outages and weather signals incorporated. 6) Continuous testing: A/B and bandits govern price and promo changes. 7) Open orchestration: swap back‑ends (annealers, QAOA, quantum‑inspired) without re‑platforming. 8) Workforce upskilling: pricing analysts become experiment owners; playbooks document guardrails. 9) Privacy by design: consent for data use and aggregation for insights. 10) CFO‑grade reporting: margin bps, cannibalization, forecast error, and SLA adherence.
Segment Analysis
Grocery & Mass: High SKU count and frequent price changes; portfolio optimization; markdown speed crucial. Electronics: Price‑match pressure; attach bundles and warranty optimization. Home & DIY: Seasonal demand; zone pricing and inventory‑aware markdowns. Apparel/Footwear: Size/color depth; allocation + markdown orchestration. Pharmacy/OTC: Regulatory constraints and MAP; demand elasticity varies by condition. C‑Store & Fuel: Price board dynamics and cross‑category baskets. Across segments, define guardrails, SLAs, and KPIs; measure solve time, margin bps, cannibalization %, and refresh cadence.
Geography Analysis
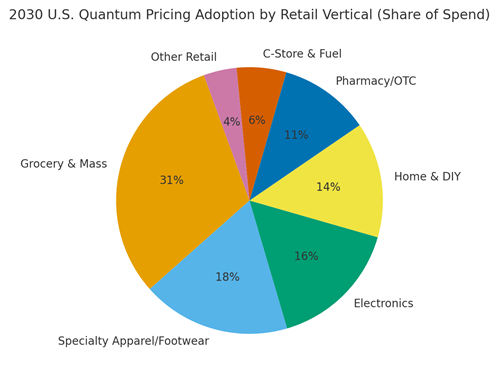
By 2030, adoption mix by U.S. retail vertical is modeled as Grocery & Mass (~31%), Specialty Apparel/Footwear (~18%), Electronics (~16%), Home & DIY (~14%), Pharmacy/OTC (~11%), C‑Store & Fuel (~6%), and Other (~4%). Coastal tech hubs adopt earlier due to data maturity and vendor proximity; broader adoption follows as quantum‑as‑a‑service pricing falls and orchestration layers mature. The pie figure reflects vertical share of spend.
Execution: centralize feature engineering and governance; allow divisions to tune guardrails and objectives. Track geography‑specific ROI and SLA adherence; pilot in price‑volatile zones to surface value quickly.
Competitive Landscape
Incumbent pricing vendors add quantum‑inspired solvers; new entrants focus on back‑end access and orchestration. Differentiation vectors: (1) solver speed and scalability, (2) elasticity quality and causal inference, (3) guardrails and fairness tooling, (4) explain ability and audit trails, and (5) cost and SLA transparency. Procurement guidance: demand open APIs, portable model specs, back‑end neutrality, and champion‑challenger support. Competitive KPIs: solve time, margin bps, cannibalization %, MAPE, refresh cadence, and cost per optimized SKU.
Report Details
Proceed To Buy
Want a More Customized Experience?
- Request a Customized Transcript: Submit your own questions or specify changes. We’ll conduct a new call with the industry expert, covering both the original and your additional questions. You’ll receive an updated report for a small fee over the standard price.
- Request a Direct Call with the Expert: If you prefer a live conversation, we can facilitate a call between you and the expert. After the call, you’ll get the full recording, a verbatim transcript, and continued platform access to query the content and more.
68 Circular Road, #02-01 049422, Singapore
Revenue Tower, Scbd, Jakarta 12190, Indonesia
4th Floor, Pinnacle Business Park, Andheri East, Mumbai, 400093
Cinnabar Hills, Embassy Golf Links Business Park, Bengaluru, Karnataka 560071
Request Custom Transcript
Related Transcripts

$ 1395


68 Circular Road, #02-01 049422, Singapore
Revenue Tower, Scbd, No.52-53, Jakarta 12190, Indonesia
Cinnabar Hills, Embassy Golf Links Business Park, Bengaluru, Karnataka 560071
4th Floor, Pinnacle Business Park, Andheri East, Mumbai, 400093


68 Circular Road, #02-01 049422, Singapore
Revenue Tower, Scbd, Jakarta 12190, Indonesia
4th Floor, Pinnacle Business Park, Andheri East, Mumbai, 400093
Cinnabar Hills, Embassy Golf Links Business Park, Bengaluru, Karnataka 560071