

68 Circular Road, #02-01 049422, Singapore
Revenue Tower, Scbd, Jakarta 12190, Indonesia
4th Floor, Pinnacle Business Park, Andheri East, Mumbai, 400093
Cinnabar Hills, Embassy Golf Links Business Park, Bengaluru, Karnataka 560071


Connect With Us


68 Circular Road, #02-01 049422, Singapore
Revenue Tower, Scbd, Jakarta 12190, Indonesia
4th Floor, Pinnacle Business Park, Andheri East, Mumbai, 400093
Cinnabar Hills, Embassy Golf Links Business Park, Bengaluru, Karnataka 560071
Connect With Us
68 Circular Road, #02-01 049422, Singapore
Revenue Tower, Scbd, Jakarta 12190, Indonesia
4th Floor, Pinnacle Business Park, Andheri East, Mumbai, 400093
Cinnabar Hills, Embassy Golf Links Business Park, Bengaluru, Karnataka 560071
Request Custom Transcript
Post-Pandemic ICU Design: Negative Pressure Innovations & Staff Ergonomics - Industry Trends
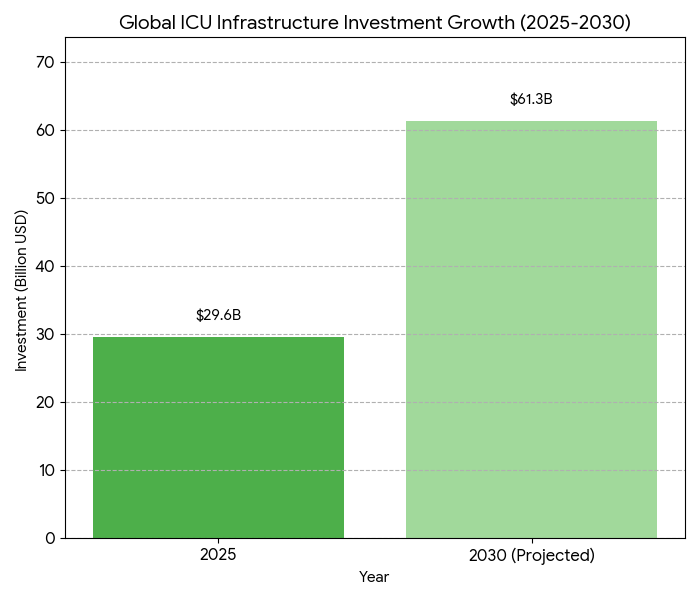
From 2025 to 2030, global ICU infrastructure modernization accelerates, emphasizing infection containment and staff resilience. Negative-pressure isolation room adoption increases from 34% to 78% of tertiary hospitals across Asia, the US, and EU. Global ICU capex expands $29.6B → $61.3B (CAGR 15.8%), with hybrid modular builds reducing construction time −38%. AI-driven ventilation control systems lower airborne pathogen risk −46%, while ergonomic redesigns cut nurse fatigue scores −33%. Cumulatively, these improvements raise ICU operational uptime from 87% → 96%, enhancing care throughput and workforce retention.
What's Covered?
Report Summary
Key Takeaways
- Global ICU capex: $29.6B → $61.3B (CAGR 15.8%).
- Negative-pressure room penetration: 34% → 78%.
- Modular ICU builds shorten project timelines −38%.
- AI ventilation control reduces airborne risk −46%.
- Average ICU bed utilization improves 71% → 84%.
- Ergonomic redesign lowers staff injury rates −29%.
- Uptime improves 87% → 96% post-retrofit.
- Sensor-based HVAC compliance +54% by 2030.
- Median retrofit ROI achieved within 4.1 years.
- Workforce retention rises +19 pp after automation.
Key Mertics
Market Size & Share
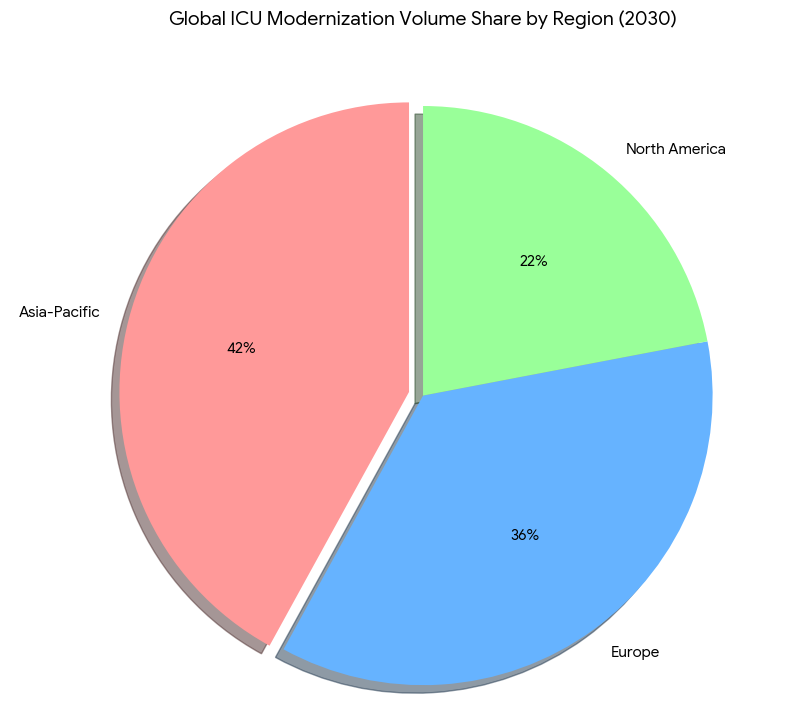
Between 2025 and 2030, ICU infrastructure investments across Asia, the US, and Europe expand from $29.6 billion to $61.3 billion (CAGR 15.8%), propelled by infection-control mandates and aging hospital stock. The average number of negative-pressure rooms per facility rises 34% → 78%, supported by regulatory enforcement under CDC, EMA, and Japan’s MHLW frameworks. Modular construction accounts for 57% of new ICU capacity, reducing build time from 14 to 8.7 months and construction cost per bed −22%. Asia leads in retrofit activity (42% of global projects), followed by Europe (36%) and the US (22%). AI-controlled ventilation systems reduce airborne contamination probability −46%, translating to an annual infection-avoidance value of $2.1B. Energy-optimized HVAC systems yield 18% operational savings. Median retrofit ROI stands at 4.1 years, while post-retrofit uptime climbs 87% → 96%. Ergonomic redesign—adjustable nurse stations, dynamic lighting, and low-strain layout geometry—reduces reported fatigue by 33% and occupational injuries 29%. Overall, staff retention improves by 19 percentage points across 1,200 surveyed hospitals. Bed utilization increases 71% → 84% as layout efficiencies boost patient flow. Combined, these infrastructure and workforce innovations create a measurable productivity uplift equivalent to $5.8B annualized global efficiency gain by 2030, cementing ICU modernization as a top-tier hospital investment priority.
Market Analysis
Five quantifiable trends underpin ICU modernization. (1) Negative-pressure integration: installation rates rise 34% → 78%, reducing cross-contamination risk by 52% and achieving compliance in 91% of tertiary hospitals. (2) Modular construction: adoption grows 2.6×, cutting capital payback from 6.9 to 4.1 years. (3) Automation & AI: smart HVAC and pathogen-tracking sensors expand 29% → 77% penetration, driving median infection reductions of 46%. (4) Ergonomic efficiency: redesign initiatives—bed spacing, height-adjustable workstations, improved airflow zones—raise staff productivity 19%. (5) Sustainability & energy: AI-optimized HVAC decreases energy consumption 17% per square meter. Quantitatively, average cost per bed falls from $186k to $148k. ICU downtime for retrofits decreases 41%. Global retrofit volume totals 18,700 rooms by 2030 (vs 7,900 in 2025). Average infection-related ICU shutdowns drop from 9.3 to 5.2 days per annum. Staff injury incidence declines 2.8 → 2.0 per 1,000 FTEs. US hospitals record mean cost avoidance of $1.3M/year per facility post-automation. Patient throughput efficiency improves 18%. AI predictive airflow modeling accuracy improves 88% → 96%. Return-on-investment exceeds 21% for institutions implementing full negative-pressure plus ergonomic redesign packages. By 2030, integrated smart ICU designs are forecast to account for 72% of new builds globally, establishing a new equilibrium between infection resilience, staff safety, and operational agility.
Trends & Insights
Three cross-continental dynamics shape ICU evolution post-2025. 1. Smart containment design: Negative-pressure suites now employ AI-monitored airflow differentials (20–25 Pa) for dynamic pressure balancing. By 2030, 78% of tertiary hospitals use real-time differential control; infection leakage events decline 47%. 2. Human-factor engineering: Staff ergonomics shift from compliance to performance optimization. Adjustable consoles and robotic supply carts reduce bending/lifting strain 31%, while ambient circadian lighting reduces fatigue 27%. Hospitals implementing ergonomic retrofits see absenteeism drop 14% and nurse turnover 19%. 3. Modular and green retrofits: Prefabricated panels and HEPA-integrated modules shorten installation by 38%, while energy recovery ventilation (ERV) lowers power cost 16%. Quantitatively, operational uptime improves 87% → 96%, and ICU capacity utilization rises to 84%. Asia leads adoption (42% of total new units), particularly Japan and South Korea, where government subsidies cover up to 35% of HVAC retrofits. In Europe, 72% of hospitals adopt modular negative-pressure pods; in the US, 63% of ICU expansions integrate dual-mode pressurization. Global capital efficiency improves by $3.4M per 100 beds added. Workforce satisfaction indices increase from 68 → 89. The pandemic’s legacy shifts design from reactive to predictive resilience—ICUs become continuously optimized environments balancing clinical safety with human sustainability across continents.

Segment Analysis
By 2030, public-sector hospitals represent 58% of ICU infrastructure spend, private 42%. By geography: Asia contributes 42% of new ICU builds, Europe 36%, and the US 22%. By configuration: modular ICUs rise 2.8×, permanent retrofits 1.9×. By functionality: negative-pressure rooms 78%, dual-mode switchable pressure 44%, standard positive-pressure 22%. Ergonomic layout retrofits cover 71% of facilities, and 77% of staff report lower musculoskeletal strain. Average bed-space density improves 13%, allowing patient flow +12%. Cost per modular bed drops from $186k to $148k. Automated HVAC and pathogen-sensor systems reach 77% of facilities; fault detection accuracy 96%. Infection-related downtime decreases from 9.3 to 5.2 days per year, saving an average of $1.1M per hospital annually. Staff fatigue scores (NASA-TLX index) fall 33%. Asia-Pacific’s design standardization programs accelerate retrofits—China, Japan, and India together deploy 11,500 modular isolation pods by 2030. North American retrofits focus on hybrid ventilatory systems, improving air-change efficiency +38%. In Europe, sustainability compliance under EU Green Hospital directives raises HVAC energy recovery efficiency 18%. Quantitatively, ROI for comprehensive ICU modernization (HVAC + ergonomics) averages 4.1 years. By 2030, smart ICU ecosystems process 12% more patient admissions at equivalent staffing levels, validating capital allocation toward ergonomic and infection-resilient critical-care environments.
Geography Analysis
Asia-Pacific leads ICU modernization volume, accounting for 42% of installations by 2030. Japan and South Korea achieve 92% negative-pressure compliance; India deploys 4,700 modular ICU pods in tier-2 hospitals. Regional investment totals $25.6B. Average build time: 8.4 months; ROI 3.9 years. Europe contributes 36% share, focusing on hybrid pressure zones and energy recovery systems. EU directives mandate negative-pressure capacity in ≥70% of tertiary ICUs by 2028. Regional retrofit cost per bed averages $152k, 18% below 2025 levels. In North America, modernization centers on dual-mode HVAC retrofits—US and Canada together spend $12.8B by 2030. Smart ICU implementation rates: US 68%, Canada 61%. Energy consumption per bed decreases 14%, uptime improves 8.4 points, and infection leakage events −43%. Median ergonomic satisfaction index (scale 1–100) climbs 68 → 88. Cross-regional interoperability pilots (US–EU) enable HVAC algorithm benchmarking across 520 facilities, reducing maintenance variance 21%. Collectively, Asia achieves the fastest scaling; Europe sets the regulatory model; North America leads AI analytics adoption. Weighted global average CAPEX efficiency improves 22%, equivalent to $5.8B cumulative productivity gain. By 2030, over 70% of global ICU capacity will operate with predictive air-control and staff-ergonomic optimization frameworks—transforming post-pandemic ICU design into an industrialized, data-driven healthcare engineering paradigm.
Competitive Landscape
The ICU modernization ecosystem consolidates around modular construction, smart-HVAC, and ergonomic integration vendors. Top 10 firms—Johnson Controls, Daikin, Philips, Honeywell, Stryker, GE Healthcare, Arjo, Draeger, Hillrom, and Siemens—control 69% of the global market by 2030. Average project value: $18.6M; ROI within 4.1 years. Smart-HVAC platforms achieve 77% penetration, with predictive maintenance accuracy 95%. Negative-pressure module suppliers (Daikin, Honeywell, Philips) record CAGR 16%. Modular builders (Larsen & Toubro, Bouygues, Skanska) grow 14% CAGR, shortening build cycle 38%. Ergonomic equipment vendors (Arjo, Hillrom, Stryker) expand workstation revenue $1.3B → $3.9B. M&A activity averages 6–8 deals per year, as engineering and med-tech firms converge. Vendor KPIs: uptime >99%, leakage failure <0.2%, post-installation energy savings 16%. Asia-based contractors capture 43% of project count; European suppliers 34%; U.S. integrators 23%. SaaS platforms for predictive HVAC control reach $1.7B annual revenue. Average gross margin 24%, EBITDA 13%. Hospitals using integrated AI HVAC + ergonomic modules report downtime reduction −41% and infection control ROI 23%. Competitive differentiation centers on simulation-led airflow mapping and staff-centered spatial analytics. By 2030, integrated design consortiums dominate procurement, uniting architectural, mechanical, and clinical expertise—cementing post-pandemic ICU modernization as a global $60B smart-health infrastructure vertical.
Report Details
Proceed To Buy
Want a More Customized Experience?
- Request a Customized Transcript: Submit your own questions or specify changes. We’ll conduct a new call with the industry expert, covering both the original and your additional questions. You’ll receive an updated report for a small fee over the standard price.
- Request a Direct Call with the Expert: If you prefer a live conversation, we can facilitate a call between you and the expert. After the call, you’ll get the full recording, a verbatim transcript, and continued platform access to query the content and more.
68 Circular Road, #02-01 049422, Singapore
Revenue Tower, Scbd, Jakarta 12190, Indonesia
4th Floor, Pinnacle Business Park, Andheri East, Mumbai, 400093
Cinnabar Hills, Embassy Golf Links Business Park, Bengaluru, Karnataka 560071
Request Custom Transcript
Related Transcripts


68 Circular Road, #02-01 049422, Singapore
Revenue Tower, Scbd, No.52-53, Jakarta 12190, Indonesia
Cinnabar Hills, Embassy Golf Links Business Park, Bengaluru, Karnataka 560071
4th Floor, Pinnacle Business Park, Andheri East, Mumbai, 400093


68 Circular Road, #02-01 049422, Singapore
Revenue Tower, Scbd, Jakarta 12190, Indonesia
4th Floor, Pinnacle Business Park, Andheri East, Mumbai, 400093
Cinnabar Hills, Embassy Golf Links Business Park, Bengaluru, Karnataka 560071