

68 Circular Road, #02-01 049422, Singapore
Revenue Tower, Scbd, Jakarta 12190, Indonesia
4th Floor, Pinnacle Business Park, Andheri East, Mumbai, 400093
Cinnabar Hills, Embassy Golf Links Business Park, Bengaluru, Karnataka 560071


Connect With Us


68 Circular Road, #02-01 049422, Singapore
Revenue Tower, Scbd, Jakarta 12190, Indonesia
4th Floor, Pinnacle Business Park, Andheri East, Mumbai, 400093
Cinnabar Hills, Embassy Golf Links Business Park, Bengaluru, Karnataka 560071
Connect With Us
68 Circular Road, #02-01 049422, Singapore
Revenue Tower, Scbd, Jakarta 12190, Indonesia
4th Floor, Pinnacle Business Park, Andheri East, Mumbai, 400093
Cinnabar Hills, Embassy Golf Links Business Park, Bengaluru, Karnataka 560071
Request Custom Transcript
Plant-Based Protein Innovation: Formulation Challenges & Regulatory Compliance in European Markets
Plant‑based protein in Europe is moving from novelty to performance food. Between 2025 and 2030, brands will pair better formulation science protein functionality, lipid systems, flavor masking with compliance‑by‑design that meets EU and French standards. We model Europe’s plant‑based protein market rising from ~US$9.1B (2025) to ~US$17.0B (2030). France is set to be a growth engine thanks to premium retail, gastronomy influence, and active alt‑protein clusters. Formulation hurdles are narrowing: heat‑stable gels, improved emulsification, off‑note reduction, and fiber matrices for bite. Ingredient portfolios diversify across pea, fava, chickpea, mycoprotein, algae, canola, and precision‑fermented components. Commercial success depends on compressing R&D cycles, lowering cost per kg, lifting sensory parity, and expanding clean‑label compliance (short lists, recognizable inputs). Regulatory readiness spans novel food assessments, additive approvals, allergen labeling, and claims substantiation tied to evidence repositories and traceable supply.
What's Covered?
Report Summary
Key Takeaways
1. Performance formulation wins: gelation, emulsification, and off‑note reduction drive repeat.
2. Cost curves improve via yields, blends, and CDMO scale track US$/kg relentlessly.
3. Compliance‑by‑design: dossiers, label automation, and traceable inputs reduce delays.
4. CFO dashboard: cycle time, $/kg, sensory score, clean‑label %, approval months.
5. France advantage: gastronomy validation and premium retail activation.
6. Hybrid stacks (plant + fermented) balance cost, nutrition, and taste.
7. Chef and barista pilots accelerate velocity and credibility.
8. Evidence‑backed claims (protein quality, sat‑fat, fiber) build trust.
Key Metrics

Market Size & Share
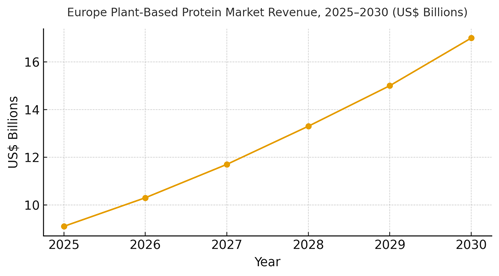
Europe’s plant‑based protein market is modeled to expand from ~US$9.1B (2025) to ~US$17.0B (2030), driven by improved ingredient functionality, cleaner labels, and better pricing discipline. France’s ~21% share stems from premium retail and culinary credibility. The line figure shows the compounded trajectory. Value pools: ingredient platforms (protein isolates/concentrates, fermented proteins), finished goods (meat analogs, ready meals, beverages), and enablement (CDMOs, QA/compliance automation).
Share dynamics: players that translate platform ingredients into chef‑validated finished goods and secure approvals quickly will gain share. Execution risks include capacity constraints, supply volatility, and dossier bottlenecks; mitigations: modular plants, diversified feedstocks, and early regulatory engagement with dossier‑ready evidence and post‑market monitoring plans.
Market Analysis
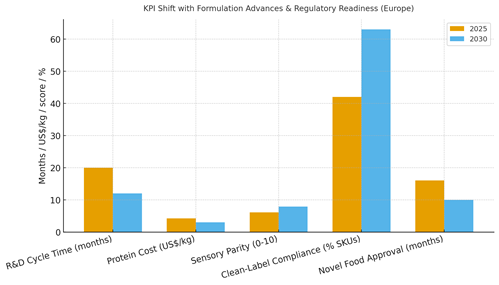
Formulation advances and regulatory readiness shift KPIs materially. We model R&D cycle time dropping from ~20 to ~12 months via modular pilots and inline analytics; protein cost declining from ~US$4.2/kg to ~US$3.0/kg through yield gains and blends; sensory parity rising from ~6.1 to ~7.9/10; clean‑label compliance expanding from ~42% to ~63% of SKUs; and novel food approval timelines tightening from ~16 to ~10 months with dossier‑ready evidence. Enablers: ingredient libraries (gelation/emulsification maps), chef panels, barista pilots, and QA/compliance automation. Barriers: feedstock costs, capacity, and claims risk.
Financial lens: evaluate contribution margin net of CDMO fees, retailer terms, and promo mix; run store/region holdouts for launches; and monitor repeat after trial. The bar chart summarizes directional improvements under disciplined operations.
Trends & Insights
1) Texture first: heat‑stable gels and fiber matrices deliver bite in hot/cold formats. 2) Flavor precision: precursor biosynthesis and targeted masking reduce beany/green notes. 3) Lipid systems: unsaturated blends with dairy‑like mouthfeel. 4) Hybridization: plant + fermented proteins for performance. 5) Compliance‑by‑design: dossiers, label automation, allergen clarity, and post‑market plans. 6) Clean labels: short lists as a competitive wedge. 7) Food‑service proofs: chefs and baristas as credibility engines in France. 8) LCA transparency: carbon/water proofs for buyers. 9) CDMO ecosystems: pooled capacity and risk hedging. 10) Measurement discipline: sensory panels, velocity, repeat, and margin post promo.
Segment Analysis
Meat Analogues: Structure and juiciness from gels/emulsions; grill stability. Ready Meals: Reheat stability and flavor clarity; family formats. Beverages & RTM: Solubility and mouthfeel; café foaming variants. Deli/Cold Cuts: Slice ability and binding without long labels. Bakery & Snacks: Protein enrichment with texture retention. Across segments, define claims thresholds and evidence; track cycle time, cost/kg, sensory, velocity, and repeat by SKU.
Geography Analysis
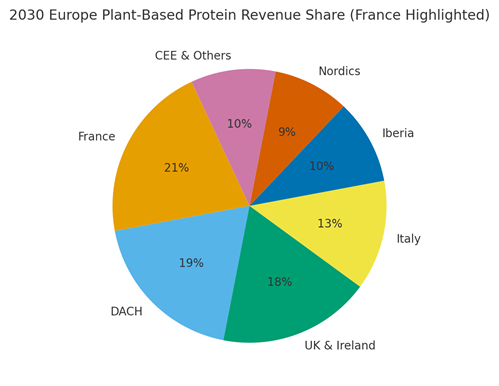
France is modeled at ~21% of Europe’s plant‑based protein revenue by 2030, with DACH (~19%), UK & Ireland (~18%), Italy (~13%), Iberia (~10%), Nordics (~9%), and CEE & Others (~10%). France benefits from premium retail placements, café channels, and chef partnerships. Localization: French language labels, culinary alignment, allergen clarity, and clean‑label positioning. The pie figure reflects the regional mix.
Execution: centralize compliance and QA; allow local formulation tweaks for cuisine; measure geography‑specific velocity and repeat; and stage activations with culinary calendars.
Competitive Landscape
Incumbents leverage distribution and brand trust; challengers differentiate on ingredient platforms and sensory performance. Differentiation vectors: (1) functional ingredient libraries and blends, (2) continuous pilot‑to‑retail loops, (3) dossier‑ready compliance automation, (4) CDMO capacity and yield, and (5) chef/barista partnerships. Procurement guidance: require data room access (sensory, yields, dossiers), open APIs for QA/labels, and capacity SLAs. Competitive KPIs: cycle time, US$/kg, sensory score, clean‑label %, approval months, retail velocity, and repeat rates.
Report Details
Proceed To Buy
Want a More Customized Experience?
- Request a Customized Transcript: Submit your own questions or specify changes. We’ll conduct a new call with the industry expert, covering both the original and your additional questions. You’ll receive an updated report for a small fee over the standard price.
- Request a Direct Call with the Expert: If you prefer a live conversation, we can facilitate a call between you and the expert. After the call, you’ll get the full recording, a verbatim transcript, and continued platform access to query the content and more.
68 Circular Road, #02-01 049422, Singapore
Revenue Tower, Scbd, Jakarta 12190, Indonesia
4th Floor, Pinnacle Business Park, Andheri East, Mumbai, 400093
Cinnabar Hills, Embassy Golf Links Business Park, Bengaluru, Karnataka 560071
Request Custom Transcript
Related Transcripts

$ 1395


68 Circular Road, #02-01 049422, Singapore
Revenue Tower, Scbd, No.52-53, Jakarta 12190, Indonesia
Cinnabar Hills, Embassy Golf Links Business Park, Bengaluru, Karnataka 560071
4th Floor, Pinnacle Business Park, Andheri East, Mumbai, 400093


68 Circular Road, #02-01 049422, Singapore
Revenue Tower, Scbd, Jakarta 12190, Indonesia
4th Floor, Pinnacle Business Park, Andheri East, Mumbai, 400093
Cinnabar Hills, Embassy Golf Links Business Park, Bengaluru, Karnataka 560071