

68 Circular Road, #02-01 049422, Singapore
Revenue Tower, Scbd, Jakarta 12190, Indonesia
4th Floor, Pinnacle Business Park, Andheri East, Mumbai, 400093
Cinnabar Hills, Embassy Golf Links Business Park, Bengaluru, Karnataka 560071


Connect With Us


68 Circular Road, #02-01 049422, Singapore
Revenue Tower, Scbd, Jakarta 12190, Indonesia
4th Floor, Pinnacle Business Park, Andheri East, Mumbai, 400093
Cinnabar Hills, Embassy Golf Links Business Park, Bengaluru, Karnataka 560071
Connect With Us
68 Circular Road, #02-01 049422, Singapore
Revenue Tower, Scbd, Jakarta 12190, Indonesia
4th Floor, Pinnacle Business Park, Andheri East, Mumbai, 400093
Cinnabar Hills, Embassy Golf Links Business Park, Bengaluru, Karnataka 560071
Request Custom Transcript
Plant-Based Dairy Alternatives: Fermentation Tech Advancements & EU Novel Food Compliance
Plant‑based dairy is entering its performance era. Between 2025 and 2030, European players combine precision/fermented proteins, improved lipid structuring, and strain engineering with compliance‑by‑design to deliver products that close sensory gaps while meeting EU Novel Food requirements. We model Europe’s plant‑based dairy and fermentation‑tech revenue growing from ~US$10.4B in 2025 to ~US$20.0B by 2030. France is poised to lead adoption due to premium retail, culinary culture, and active food‑tech clusters. Technology vectors: (1) precision fermentation to supply casein‑like and whey‑like proteins for melt/stretch and foaming; (2) microbial and enzymatic lipid engineering for dairy‑like mouthfeel without saturated fat penalties; (3) flavor precursor biosynthesis and controlled fermentation to reduce off‑notes; and (4) continuous bioprocessing and inline QA to cut cycle times and cost. Commercially, success shows up as faster R&D cycles, lower cost per liter, rising sensory parity scores, higher retail velocity, and shorter approval timelines under EU Novel Food.
What's Covered?
Report Summary
Key Takeaways
1. Precision/fermented proteins and lipid engineering close taste/texture gaps.
2. Continuous bioprocess + inline QA compress R&D cycles and reduce cost per liter.
3. Compliance‑by‑design: dossier‑ready evidence and traceable inputs from day one.
4. CFO‑grade KPIs: cycle time, $/L, sensory score, retail velocity, approval months.
5. France advantage: gastronomy alignment, barista channels, premium retail partners.
6. Risk hedges: diversified CDMOs, feedstock sourcing, modular plants.
7. Claims discipline: specific, validated, and transparent to build trust.
8. Retail activation: chef panels, barista SKUs, and frictionless sampling.
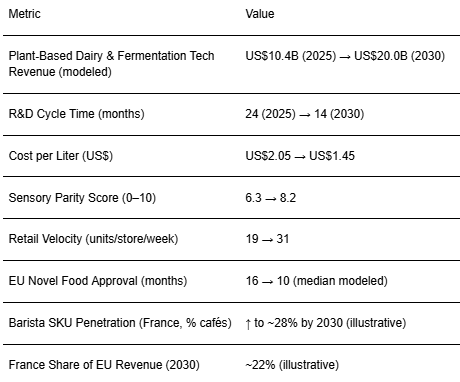
Key Metrics
Market Size & Share
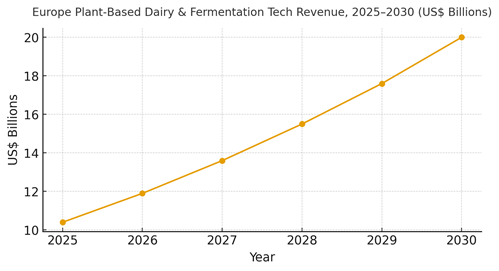
Europe’s plant‑based dairy and fermentation‑tech market is modeled to expand from ~US$10.4B (2025) to ~US$20.0B (2030). Growth is driven by maturation in protein and lipid tech, improved sensory profiles, and mainstream retail/food‑service adoption. France’s ~22% share reflects premium retail, café culture, and strong food‑tech partnerships. The line figure charts the compounded trajectory.
Share dynamics across the stack: ingredient platforms (precision‑fermented proteins, lipids), finished goods (milks, yogurts, cheeses, creams), and enablement (CDMOs, QA, compliance). Leaders win share by linking platform ingredients to chef‑validated finished goods and deploying compliance‑ready evidence from the outset. Execution risks include capacity bottlenecks and dossier delays; mitigations include modular bioprocess lines and early regulatory engagement.
Market Analysis
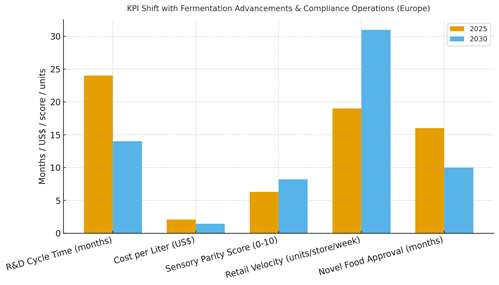
Fermentation and compliance operations shift KPIs materially. We model R&D cycle time compressing from ~24 to ~14 months through continuous bioprocess and inline analytics; cost per liter declining from ~US$2.05 to ~US$1.45 via scale and yields; sensory parity improving from ~6.3 to ~8.2 on a 10‑point panel; retail velocity rising from ~19 to ~31 units/store/week via taste parity and barista SKUs; and approval timelines falling from ~16 to ~10 months with dossier‑ready evidence and prior engagement. Enablers: CDMO partnerships, modular plants, robust QA, and claims discipline. Barriers: feedstock costs, capacity constraints, and claims scrutiny.
Financial lens: attribute to contribution margin net of CDMO fees, opex, and retailer terms; use store/region holdouts for activations; and track repeat rates post‑trial. The bar chart summarizes directional KPI improvements under disciplined operations.
Trends & Insights
1) Precision proteins meet lipids: co‑optimization unlocks melt/stretch and foam stability. 2) Continuous bioprocessing: shorter cycles and better yields. 3) Compliance‑by‑design: evidence repositories, label automation, and traceable inputs. 4) Barista and chef programs: early adoption and credibility. 5) Hybrid products: plant‑plus‑fermented ingredient blends for price/performance. 6) LCA transparency: carbon and water disclosures as table stakes. 7) Regional palates: French culinary alignment improves repeat. 8) Smart sampling: micro‑trials in cafés and retailers reduce CAC. 9) CDMO ecosystems: capacity pooling and risk hedging. 10) Outcome measurement: sensory panels, velocity, and repeat tracked with holdouts.
Segment Analysis
Milks & Barista: Foam stability, flavor clarity, and price discipline drive share; café channels matter in France. Yogurts: Texture and clean acidity with live cultures; spoon ability drives repeat. Cheeses: Fermented proteins and lipids for melt/stretch; aged profiles for premium niches. Creams & Cooking: Heat stability and emulsification; culinary partnerships. Desserts: Flavor precursors and sweetener balance. Across segments, define claims thresholds, evidence, and QA; track cycle time, $/L, sensory score, and velocity by SKU and region.
Geography Analysis
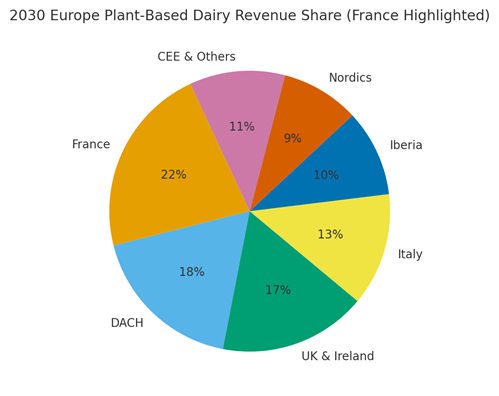
France is modeled at ~22% of Europe’s plant‑based dairy revenue by 2030, with DACH (~18%), UK & Ireland (~17%), Italy (~13%), Iberia (~10%), Nordics (~9%), and CEE & Others (~11%). France’s edge: high‑end retail, café culture, and chef credibility. Localization: French language labels, PDO‑aware positioning, and culinary partnerships. The pie figure reflects the regional mix.
Execution: centralize compliance and QA; allow local formulation tweaks; measure geography‑specific velocity and repeat; and align activation calendars with French culinary seasons.
Competitive Landscape
Incumbents leverage distribution and brand trust; challengers differentiate on ingredient platforms and sensory parity. Differentiation vectors: (1) precision‑fermented protein portfolio, (2) lipid structuring and flavor precursors, (3) continuous bioprocess yields, (4) dossier‑ready evidence and label automation, and (5) barista/chef partnerships. Procurement guidance: require open APIs for QA/compliance data, CDMO capacity commitments, and sensory/velocity benchmarks. Competitive KPIs: cycle time, $/L, sensory score, retail velocity, approval months, and repeat purchase rates.
Report Details
Proceed To Buy
Want a More Customized Experience?
- Request a Customized Transcript: Submit your own questions or specify changes. We’ll conduct a new call with the industry expert, covering both the original and your additional questions. You’ll receive an updated report for a small fee over the standard price.
- Request a Direct Call with the Expert: If you prefer a live conversation, we can facilitate a call between you and the expert. After the call, you’ll get the full recording, a verbatim transcript, and continued platform access to query the content and more.
68 Circular Road, #02-01 049422, Singapore
Revenue Tower, Scbd, Jakarta 12190, Indonesia
4th Floor, Pinnacle Business Park, Andheri East, Mumbai, 400093
Cinnabar Hills, Embassy Golf Links Business Park, Bengaluru, Karnataka 560071
Request Custom Transcript
Related Transcripts

$ 1395


68 Circular Road, #02-01 049422, Singapore
Revenue Tower, Scbd, No.52-53, Jakarta 12190, Indonesia
Cinnabar Hills, Embassy Golf Links Business Park, Bengaluru, Karnataka 560071
4th Floor, Pinnacle Business Park, Andheri East, Mumbai, 400093


68 Circular Road, #02-01 049422, Singapore
Revenue Tower, Scbd, Jakarta 12190, Indonesia
4th Floor, Pinnacle Business Park, Andheri East, Mumbai, 400093
Cinnabar Hills, Embassy Golf Links Business Park, Bengaluru, Karnataka 560071