

68 Circular Road, #02-01 049422, Singapore
Revenue Tower, Scbd, Jakarta 12190, Indonesia
4th Floor, Pinnacle Business Park, Andheri East, Mumbai, 400093
Cinnabar Hills, Embassy Golf Links Business Park, Bengaluru, Karnataka 560071


Connect With Us


68 Circular Road, #02-01 049422, Singapore
Revenue Tower, Scbd, Jakarta 12190, Indonesia
4th Floor, Pinnacle Business Park, Andheri East, Mumbai, 400093
Cinnabar Hills, Embassy Golf Links Business Park, Bengaluru, Karnataka 560071
Connect With Us
68 Circular Road, #02-01 049422, Singapore
Revenue Tower, Scbd, Jakarta 12190, Indonesia
4th Floor, Pinnacle Business Park, Andheri East, Mumbai, 400093
Cinnabar Hills, Embassy Golf Links Business Park, Bengaluru, Karnataka 560071
Request Custom Transcript
Omnichannel Retail in the U.S.: Conversion Rates, In-Store Tech ROI & Return Optimization
U.S. retailers are treating omnichannel as an operating system not a project. From 2025 to 2030, leaders knit together web, app, store, marketplace, and last‑mile into a measurable conversion and cost engine. We model U.S. omnichannel enablement spend rising from ~US$38B (2025) to ~US$73B (2030) across WMS/OMS, clienteling, POS modernization, BOPIS/curbside, in‑store sensors, and returns optimization. Value creation shows up in higher site→store/BOPIS conversion, stronger in‑store assisted CVR, lower fulfillment cost per order, falling return rates, and a larger share of returns converted to exchanges. Execution shifts from “channels” to flows: discovery → reservation → pickup/ship → service/returns. Store tech priorities include computer‑vision shelf checks, RFID accuracy, guided picking, curbside orchestration, and associate apps. Clienteling and guided selling lift in‑store assisted conversion; post‑purchase telemetry (fit/usage) informs returns prevention.
What's Covered?
Report Summary
Key Takeaways
1. Treat omnichannel as flows (discovery→reservation→fulfillment→service), not silos.
2. Clienteling + guided selling raise in‑store assisted CVR; invest in associate apps.
3. BOPIS/curbside orchestration with tight SLOs boosts conversion and loyalty.
4. RFID + CV shelf checks lift inventory accuracy and reduce substitutions/returns.
5. Return optimization = triage to exchange/repair/refurb; price convenience fairly.
6. Measure incremental margin after fulfillment and returns not just CVR.
7. Experimentation at scale: holdouts for prompts, promises, and task routing.
8. Governance: privacy‑aware sensors, ADA‑first UX, fraud controls and fairness.
Key Metrics

Market Size & Share
U.S. omnichannel enablement spend is modeled to grow from ~US$38B in 2025 to ~US$73B by 2030 as retailers scale OMS/WMS modernization, store pick/pack, curbside orchestration, clienteling, and returns platforms. The line figure shows the compounded trajectory. Value concentrates in sectors with dense store networks (grocery, mass, specialty) and categories with high assisted selling (beauty, electronics, footwear). Share accrues to retailers that convert store assets into fulfillment and service advantages BOPIS readiness, precise inventory, and reliable curbside experiences.
Share dynamics: national chains with mature data fabrics and robotics‑adjacent store ops gain share; regionals catch up via templated playbooks. Execution risks include inventory inaccuracy, labor churn, and returns abuse; mitigations are RFID + CV checks, associate enablement, and smart policy framing. Measurement must track conversion by flow (BOPIS/curbside/ship‑from‑store), cost per order, return %, and exchange % to validate profitability alongside growth.

Market Analysis
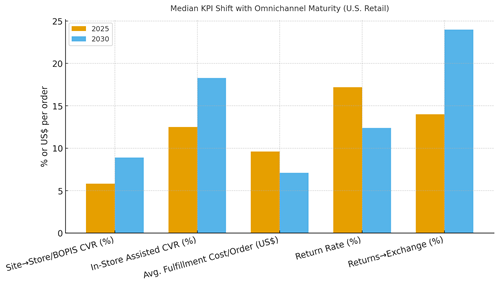
With omnichannel maturity, KPIs move in concert. We model site→store/BOPIS conversion improving from ~5.8% to ~8.9%; in‑store assisted CVR from ~12.5% to ~18.3%; fulfillment cost per order dropping from ~US$9.6 to ~US$7.1 via better batching and routing; return rates declining from ~17.2% to ~12.4% as fit and expectations improve; and returns→exchange rising from ~14% to ~24% through triage and incentives. The bar chart summarizes directional improvements. Enablers: OMS that respects store capacity, dynamic slotting, accurate inventory via RFID/CV, and associate apps that unify clienteling, picking, and service. Barriers: data fragmentation, ops adoption, and policy misalignment.
Financial lens: attribute uplift to incremental margin (after fulfillment and returns). Use geo and store‑cluster holdouts for prompts and SLO changes; monitor substitution costs; and allocate capital to flows with superior payback (BOPIS vs curbside vs ship‑from‑store).
Trends & Insights
1) Flows over channels: reserve/pickup and service loops are the new architecture. 2) Associate super‑apps: clienteling + pick/pack + service in one UX. 3) Computer vision + RFID: shelf accuracy and substitution control to protect CVR and returns. 4) Dynamic promises: real‑time slotting and capacity‑aware ETAs. 5) Returns triage: exchange incentives, repair/refurb, and smart pricing of convenience. 6) Last‑mile orchestration: batching, curbside lanes, and micro‑hubs. 7) Privacy by design: signage, zones, and retention controls for sensors. 8) Experimentation discipline: weekly tests on prompts, SLOs, and routing. 9) ADA‑first: accessible pickup and service flows expand conversion. 10) CFO‑grade dashboards: conversion by flow, cost/order, return %, exchange %.
Segment Analysis
Grocery & Mass: Highest BOPIS/curbside leverage; focus on batching, substitutions, and pickup UX. Specialty Apparel/Footwear: Fit/returns prevention and assisted selling lift; exchanges over refunds. Consumer Electronics: Consultative selling and inventory accuracy; curbside for speed. Beauty: Clienteling and samples reduce returns; store fulfillment for immediacy. Home & DIY: Bulky pickup orchestration and appointment slots. Across segments, define guardrails for promises and returns; measure per‑segment CVR, cost/order, return %, and exchange %.
Geography Analysis
By 2030, omnichannel value capture is modeled at ~33% South, ~24% Midwest, ~22% West, and ~21% Northeast. The South’s lead reflects rapid population growth and store expansion; the Midwest benefits from logistics hubs; the West from tech adoption and urban density; and the Northeast from high incomes and transit‑linked stores. The pie figure reflects the regional mix.
Execution: regionalize promises (weather, traffic), store staffing models, and return options. Track region‑specific CVR, cost/order, return %, and exchange %; iterate slotting and staffing accordingly.

Competitive Landscape
Competitors span big‑box incumbents, specialty chains, and digitally native players expanding stores. Differentiation vectors: (1) OMS/WMS modernization and accurate inventory, (2) store orchestration (BOPIS/curbside) with SLOs, (3) associate enablement and clienteling depth, (4) returns optimization and exchange incentives, and (5) analytics/experimentation discipline. Procurement guidance: demand open APIs, store‑capacity awareness, privacy‑safe sensor stacks, and clear SLAs. Competitive KPIs: CVR by flow, cost/order, substitution rate, return %, exchange %, and NPS. Winners treat omnichannel as a performance engine not a channel truce.
Report Details
Proceed To Buy
Want a More Customized Experience?
- Request a Customized Transcript: Submit your own questions or specify changes. We’ll conduct a new call with the industry expert, covering both the original and your additional questions. You’ll receive an updated report for a small fee over the standard price.
- Request a Direct Call with the Expert: If you prefer a live conversation, we can facilitate a call between you and the expert. After the call, you’ll get the full recording, a verbatim transcript, and continued platform access to query the content and more.
68 Circular Road, #02-01 049422, Singapore
Revenue Tower, Scbd, Jakarta 12190, Indonesia
4th Floor, Pinnacle Business Park, Andheri East, Mumbai, 400093
Cinnabar Hills, Embassy Golf Links Business Park, Bengaluru, Karnataka 560071
Request Custom Transcript
Related Transcripts


68 Circular Road, #02-01 049422, Singapore
Revenue Tower, Scbd, No.52-53, Jakarta 12190, Indonesia
Cinnabar Hills, Embassy Golf Links Business Park, Bengaluru, Karnataka 560071
4th Floor, Pinnacle Business Park, Andheri East, Mumbai, 400093


68 Circular Road, #02-01 049422, Singapore
Revenue Tower, Scbd, Jakarta 12190, Indonesia
4th Floor, Pinnacle Business Park, Andheri East, Mumbai, 400093
Cinnabar Hills, Embassy Golf Links Business Park, Bengaluru, Karnataka 560071