

68 Circular Road, #02-01 049422, Singapore
Revenue Tower, Scbd, Jakarta 12190, Indonesia
4th Floor, Pinnacle Business Park, Andheri East, Mumbai, 400093
Cinnabar Hills, Embassy Golf Links Business Park, Bengaluru, Karnataka 560071


Connect With Us


68 Circular Road, #02-01 049422, Singapore
Revenue Tower, Scbd, Jakarta 12190, Indonesia
4th Floor, Pinnacle Business Park, Andheri East, Mumbai, 400093
Cinnabar Hills, Embassy Golf Links Business Park, Bengaluru, Karnataka 560071
Connect With Us
68 Circular Road, #02-01 049422, Singapore
Revenue Tower, Scbd, Jakarta 12190, Indonesia
4th Floor, Pinnacle Business Park, Andheri East, Mumbai, 400093
Cinnabar Hills, Embassy Golf Links Business Park, Bengaluru, Karnataka 560071
Request Custom Transcript
Omnichannel Loyalty Programs: Data Integration Challenges & ROI Measurement in Fast Fashion
India’s fast‑fashion leaders are reframing loyalty from coupon books to data‑driven relationship engines. Between 2025 and 2030, winning programs will unify store POS, ecommerce, marketplace storefronts, and mobile apps into a single identity, stream real‑time events to decisioning systems, and price rewards against contribution margin not vanity points. We model India’s spend on the loyalty tech and retail‑media stack CDP/identity, offer decisioning, wallets, and in‑channel personalization rising from ~US$1.1B (2025) to ~US$2.75B (2030). The commercial promise is measurable: higher enrollment and activity, more frequent repeat purchases, larger baskets, and lower churn when benefits are truly omnichannel and the data fabric is clean. Integration is the bottleneck. Retailers wrestle with duplicate IDs, missing consent flags, offline‑online reconciliation, and marketplace data latency. Fixes include a canonical customer ID, receipt‑level event schemas, deterministic/probabilistic identity with confidence scores, and explicit consent states.
What's Covered?
Report Summary
Key Takeaways
1. Identity resolution and consent management are the #1 blockers of omnichannel loyalty.
2. Value‑safe rewards (exchanges, alterations, early access) beat blanket discounts on margin.
3. Receipt‑level event schemas enable clean attribution and better offer targeting.
4. Marketplace integrations need latency‑aware designs and SLA data shares.
5. Measure incremental gross margin after rewards/returns, not just AOV or CVR.
6. Holdouts (geo/cohort) and uplift models prove true ROI and prevent over‑crediting.
7. Embed size/fit and return telemetry to reduce churn and abuse risk.
8. Regional playbooks: language, seasons, and store density shift response curves.
Key Metrics

Market Size & Share
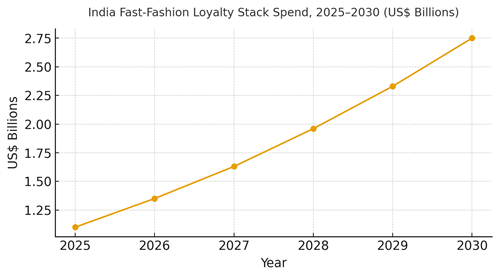
India’s fast‑fashion loyalty technology and retail‑media stack is modeled to grow from ~US$1.1B in 2025 to ~US$2.75B by 2030 as brands shift from coupon programs to identity‑driven, omnichannel systems. Spend concentrates among national chains and digital‑first players with strong app penetration; regional retailers expand as marketplace integrations and store digitization mature. The line figure depicts the growth trajectory through 2030.
Share dynamics within the stack: CDP/identity and consent orchestration lead investment initially, followed by in‑session decisioning, wallets, and app‑level personalization. Retail media tie‑ins (sponsored listings/segments) monetize loyalty data, but must be measured against shopper experience and margin. Execution risks include duplicate identities, slow marketplace data, and poor returns handling that erodes member trust. Programs that win share standardize schemas (receipt/item/return), maintain audited consent states, and run disciplined experiment cadences with regional localization for language, climate, and festive seasons.
Market Analysis
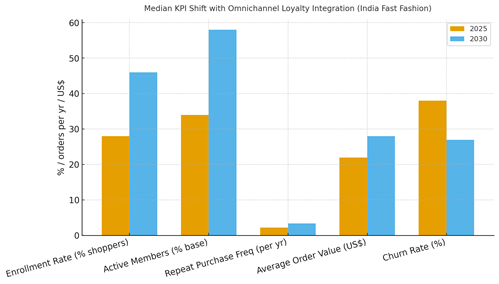
Omnichannel integration shifts KPIs when identity, consent, and events are clean. We model enrollment moving from ~28% to ~46%, active members from ~34% to ~58%, repeat purchase frequency from ~2.2 to ~3.4 orders/year, AOV from ~US$22 to ~US$28, and annual churn from ~38% down to ~27% by 2030. Enablers: canonical IDs with confidence scoring, deterministic/probabilistic match rules, streaming from POS/e‑comm/app/marketplaces, and offer decisioning with <300 ms latency. Barriers: fragmented schemas, missing consent flags, and returns abuse.
Financial lens: measure incremental gross margin after rewards and returns, redemption cost vs breakage, tier liability, and halo on retail media. Use geo holdouts and cohort‑matched tests to avoid crediting organic behavior. The bar chart summarizes the plausible KPI shift when omnichannel loyalty is run as a performance discipline with fairness and consent guardrails.
Trends & Insights
1) Identity as foundation: canonical IDs, consent states, and event quality trump fancy mechanics. 2) Utility‑rich rewards: exchanges, alterations, priority delivery, and early access protect margin and feel premium. 3) Size/fit intelligence: route members to best‑fit sizes; throttle risky orders to cut returns. 4) Retail media synergy: loyalty segments power ads measure uplift and guard brand experience. 5) Fraud controls: device, return, and order anomaly scoring applied to tier privileges. 6) Experimentation cadence: weekly offer tests and frequency caps prevent fatigue. 7) Marketplace eligibility: SLA‑backed data feeds determine whether off‑platform orders count for tiers. 8) Regionalization: language, climate, and festive calendars drive response; keep a central library with localized variants. 9) Privacy UX: clear consent toggles and value explanations raise opt‑ins. 10) CFO dashboards: incremental margin, liability coverage, redemption cost, and churn movement.
Segment Analysis
Women’s Fashion: High frequency; exchanges/alterations and size guidance lower churn. Men’s Fashion: Bundles and personalization; loyalty accelerates wardrobe refresh cycles. Kids & School: Seasonal spikes; subscriptions for uniforms/basics. Footwear: Fit and size exchanges; returns risk management. Accessories: Add‑on economics; early access and limited drops. Across segments, define tiered benefits (service speed, exchanges, early access) and align offers with margin and return risk. Track per‑segment KPIs: repeat frequency, AOV, return rate, and incremental margin after rewards.
Geography Analysis
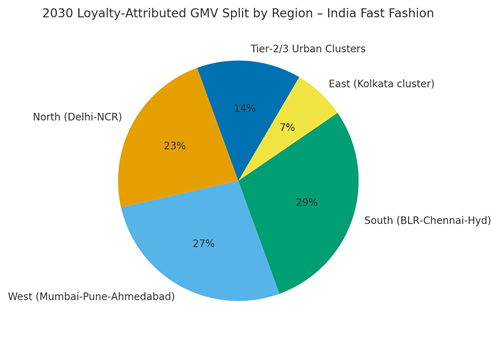
By 2030, loyalty‑attributed GMV concentrates in South (~29%), West (~27%), and North (~23%), with East (~7%) and Tier‑2/3 urban clusters (~14%) expanding as app penetration and store digitization improve. Southern metros (Bengaluru, Chennai, Hyderabad) benefit from tech adoption and creator ecosystems; Western hubs (Mumbai, Pune, Ahmedabad) concentrate commerce and payments; Northern markets (Delhi‑NCR) mix media and retail density. East scales with logistics expansion; Tier‑2/3 growth is driven by vernacular UX and COD/UPI parity. The pie chart shows the modeled regional split by 2030.
Localization: adjust benefits and messaging for climate and festival calendars; ensure store staff can honor app benefits; and translate consent/value explanations to regional languages. Measure region‑specific uplift and adapt tier thresholds accordingly.
Competitive Landscape
Stacks converge around CDP/identity, consent, offer decisioning, wallets, CRM, and retail media. Incumbent chains scale via owned apps and stores; challengers differentiate with agile data fabrics and utility‑rich reward catalogs. Differentiation vectors: (1) identity/consent quality and dedupe, (2) latency and decisioning depth, (3) returns/fit intelligence linked to offers, (4) marketplace eligibility and SLAs, and (5) analytics with holdouts and uplift models. Procurement guidance: demand open APIs, clear data contracts, fraud/returns controls, and liability accounting. Competitive KPIs: enrollment, active %, repeat frequency, AOV, churn, and incremental gross margin after rewards and returns.
Report Details
Proceed To Buy
Want a More Customized Experience?
- Request a Customized Transcript: Submit your own questions or specify changes. We’ll conduct a new call with the industry expert, covering both the original and your additional questions. You’ll receive an updated report for a small fee over the standard price.
- Request a Direct Call with the Expert: If you prefer a live conversation, we can facilitate a call between you and the expert. After the call, you’ll get the full recording, a verbatim transcript, and continued platform access to query the content and more.
68 Circular Road, #02-01 049422, Singapore
Revenue Tower, Scbd, Jakarta 12190, Indonesia
4th Floor, Pinnacle Business Park, Andheri East, Mumbai, 400093
Cinnabar Hills, Embassy Golf Links Business Park, Bengaluru, Karnataka 560071
Request Custom Transcript
Related Transcripts


68 Circular Road, #02-01 049422, Singapore
Revenue Tower, Scbd, No.52-53, Jakarta 12190, Indonesia
Cinnabar Hills, Embassy Golf Links Business Park, Bengaluru, Karnataka 560071
4th Floor, Pinnacle Business Park, Andheri East, Mumbai, 400093


68 Circular Road, #02-01 049422, Singapore
Revenue Tower, Scbd, Jakarta 12190, Indonesia
4th Floor, Pinnacle Business Park, Andheri East, Mumbai, 400093
Cinnabar Hills, Embassy Golf Links Business Park, Bengaluru, Karnataka 560071