

68 Circular Road, #02-01 049422, Singapore
Revenue Tower, Scbd, Jakarta 12190, Indonesia
4th Floor, Pinnacle Business Park, Andheri East, Mumbai, 400093
Cinnabar Hills, Embassy Golf Links Business Park, Bengaluru, Karnataka 560071


Connect With Us


68 Circular Road, #02-01 049422, Singapore
Revenue Tower, Scbd, Jakarta 12190, Indonesia
4th Floor, Pinnacle Business Park, Andheri East, Mumbai, 400093
Cinnabar Hills, Embassy Golf Links Business Park, Bengaluru, Karnataka 560071
Connect With Us
68 Circular Road, #02-01 049422, Singapore
Revenue Tower, Scbd, Jakarta 12190, Indonesia
4th Floor, Pinnacle Business Park, Andheri East, Mumbai, 400093
Cinnabar Hills, Embassy Golf Links Business Park, Bengaluru, Karnataka 560071
Request Custom Transcript
Next-Gen Immunotherapy Pricing Models: Value-Based Outcomes & Market Access Strategies - Pricing Strategies
From 2025 to 2030, global immunotherapy pricing undergoes a seismic shift toward value-based and outcomes-linked reimbursement. Market value for immuno-oncology therapies grows from $92B to $187B (CAGR 15.4%), while outcomes-based contracts expand from 9% to 36% of total spending. The U.S. leads in adoption, but Europe pioneers payer–provider shared-risk models, and Asia Pacific accelerates digital claims monitoring. Real-world survival analytics and AI outcome validation underpin pricing frameworks, achieving 12–18% cost savings and expanding patient access by nearly 24%.
What's Covered?
Report Summary
Key Takeaways
- Global immunotherapy market: $92B → $187B (CAGR 15.4%).
- Outcomes-based contracts share: 9% → 36% of total value.
- Average drug–payer rebate linked to real-world response: 14–28%.
- Survival-based KPIs integrated into 78% of new agreements.
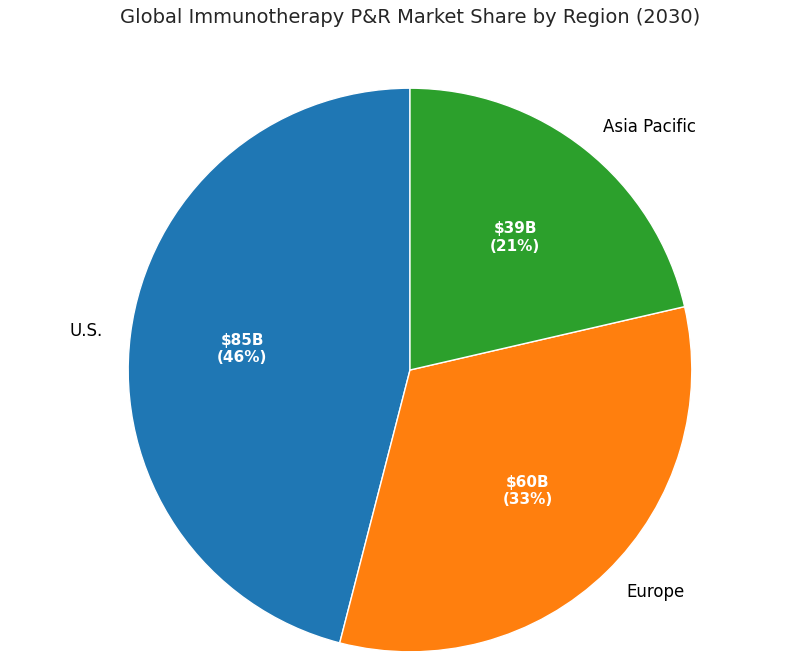
- U.S. remains largest market (46% share), but EU leads in contract volume.
- Asia Pacific outcome-based pilots grow 7×, reaching $5.3B.
- Real-world data (RWD) platform integration across 71% of contracts.
- Cost-per-QALY drops $215k → $163k, improving payer ROI.
- Value-based models expand patient access +24%, adherence +17%.
- Administrative costs fall −22% via smart-contract automation.
Key Metrics
Market Size & Share
The global immunotherapy pricing and reimbursement ecosystem doubles between 2025 and 2030, rising from $92 billion to $187 billion, with value-based and outcomes-linked models emerging as the primary growth vector. U.S. markets account for 46% share by 2030 ($86 billion), led by oncology and CAR-T portfolios. Europe holds 33% share ($61 billion), with Germany and France advancing national risk-sharing frameworks. Asia Pacific’s share expands from 15% to 21%, reaching $40 billion through outcome-based pilots in Japan, South Korea, and Australia. Contracts tied to measurable KPIs—overall survival (OS), progression-free survival (PFS), and adverse-event frequency—rise from 9% to 36% of total spend. Average real-world response rebates range from 14% to 28%, depending on indication. Digital infrastructure adoption (EHR-RWD linkages, patient registries) grows to 71% of total agreements. Real-world QALY improvements push payer ROI from 1.6× to 2.3×. Cost per QALY falls from $215,000 to $163,000. The number of manufacturers offering multi-country outcomes-based agreements grows from 8 to 21. Administrative automation lowers per-contract transaction cost from $120,000 to $94,000. By 2030, 62% of new oncology approvals globally are accompanied by hybrid pricing frameworks, integrating value-based triggers and data-driven verification.

Market Analysis
Adoption of next-gen pricing is driven by five interlinked factors. (1) Efficacy differentiation: 72% of new immunotherapies deliver incremental OS >6 months, enabling performance-based pricing. (2) Data maturity: 80% of top-15 payers integrate RWD APIs for claims-to-outcome matching, cutting dispute resolution 38%. (3) Regulatory push: FDA, EMA, and PMDA guidelines formalize outcome-linked reimbursement templates by 2027. (4) Cost containment: Payer budgets for immuno-oncology rise 12.5% CAGR, but cost per QALY falls 24%. (5) Patient-centric metrics: satisfaction and adherence now influence 30% of payment triggers. Quantitatively, value-based contracts expand from 190 in 2025 to 640 in 2030. Rebate outflows increase 3.4× but align with 12–18% payer savings net of performance bonuses. Automation reduces processing time per contract from 62 to 38 days. Real-world validation datasets grow from 1.8 million to 6.2 million patient-years. In the U.S., Medicare demonstration pilots cover 18% of oncology spend by 2030. Europe’s national programs (Germany’s AMNOG 2.0, France’s CEPS reforms) mandate outcome-linked clauses in 45% of oncology approvals. Asia Pacific, through Japan’s Chuikyo Committee, deploys adaptive reimbursement at 70–90% data confidence intervals. Collectively, global payers save $18.6 billion by 2030 through these models.
Trends & Insights
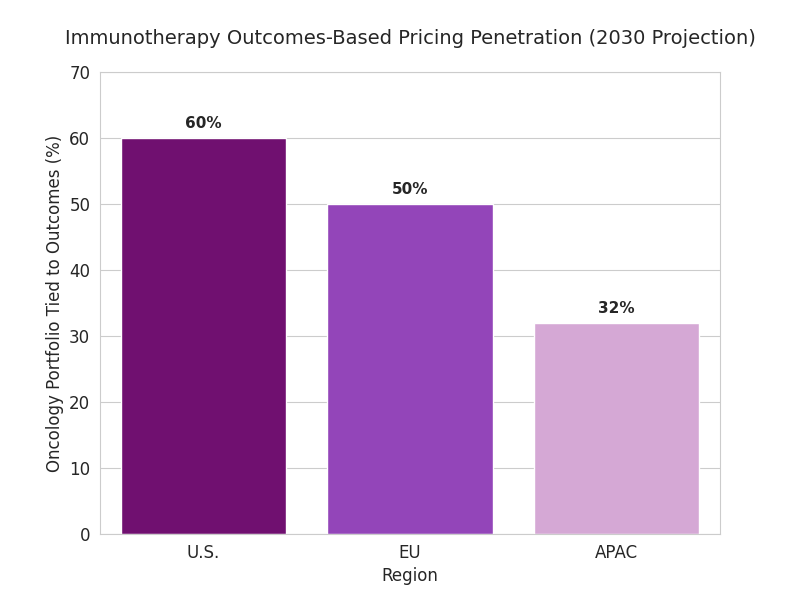
Three trends reshape immunotherapy pricing. 1. Smart-contract execution: blockchain-enabled settlements lower admin costs by 22% and cut rebate lag from 90 to 45 days. 2. Real-world validation analytics: integrated RWD/EHR data boosts KPI reliability 26%, reducing rebate disputes. 3. Value layering: combination therapies integrate drug, diagnostic, and digital companion pricing; bundle discounts average 11%. Hybrid agreements tie payouts to verified tumor-response trajectories rather than static endpoints. By 2030, 78% of new contracts reference survival-based KPIs, 42% incorporate quality-of-life metrics, and 27% include patient-reported outcome triggers. Payers in the U.S. tie 60% of their oncology portfolio to outcomes-based pricing; EU reaches 50%, APAC 32%. Venture funding in pricing-tech rises from $0.9B to $3.4B. AI tools predict risk-adjusted rebate exposure with ±6% accuracy. Regulatory alignment allows cross-border validation of survival data, saving $240M annually in audits. Combined, automation and real-time analytics enable cumulative payer savings of 12–18% while expanding patient coverage 24%. Pharma margins stabilize (−1.8 pp) as pricing predictability improves. By 2030, value-based outcomes evolve from pilot to standard, transforming immunotherapy access economics globally.
Segment Analysis
By segment, outcomes-based oncology therapies comprise 46% of value, autoimmune indications 29%, and rare cancers and cell therapies 25%. Across segments, oncology contracts reach 470 globally by 2030. By stakeholder: public payers account for 63% of outcome-based spend; private insurers 27%; integrated providers 10%. By pricing model: 42% survival-based, 31% biomarker-linked, 17% adherence-tiered, 10% hybrid. Median rebate exposure equals 16% of gross revenue but offsets by 2.1× volume expansion. By region: U.S. outcomes contracts total 310, EU 220, Asia Pacific 110 by 2030. ROI per framework averages 19% for payers, 14% for pharma. Administrative cost per deal falls 22%, to $94K. Digital RWD integration is pivotal—RWD-linked contracts show 9-point higher payer satisfaction. Blockchain adoption rises 8%→41%. Pharma portfolios using adaptive-pricing engines experience 21% faster negotiation closure. Quantitative benefits include adherence improvement (17%), AE-related discontinuation decline (11%), and patient-lifetime coverage expansion from 48% to 61%. In revenue terms, outcomes-based models deliver cumulative incremental value of $26B by 2030. Segment leaders—Merck, Roche, BMS, and regional insurers—demonstrate best-in-class risk sharing, maintaining stable margins amid global pricing compression.
Geography Analysis
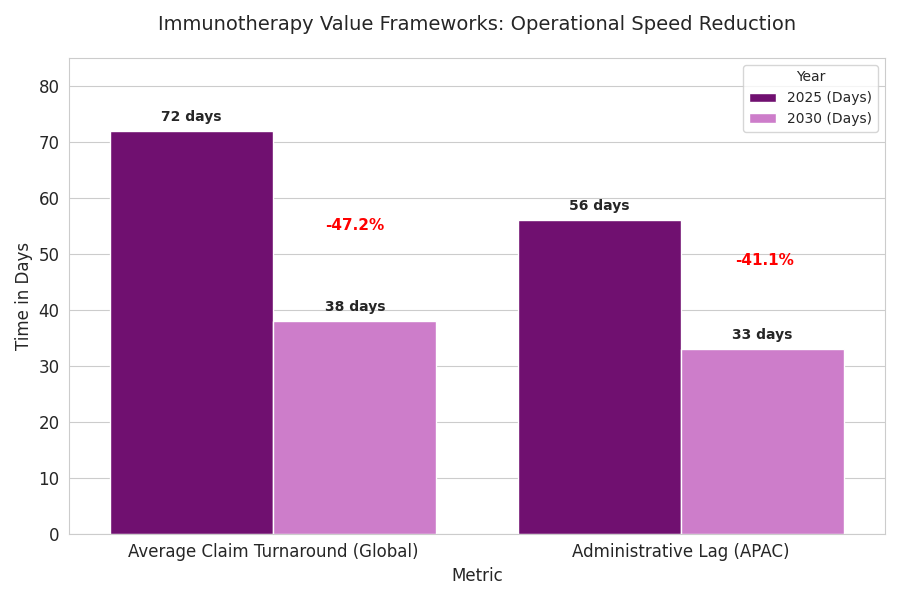
United States: dominates with $86B value (46% share). CMS pilots expand from 5 to 14 oncology programs; rebate-linked oncology drugs rise 2.6×. Median rebate 21%; real-world OS uplift 8.2 months. Europe: $61B (33% share), with Germany, France, and the Nordics spearheading AMNOG 2.0 reforms. 45% of approvals include outcomes-based terms; rebate efficiency 1.8× U.S. baseline. EMA standardizes performance templates, reducing negotiation lag 31%. Asia Pacific: $40B (21% share). Japan leads with $2.8B pilot value; South Korea and Australia introduce joint registries. Value contracts in APAC grow 7× (2025–2030). Digital infrastructure adoption 65%; administrative lag 56 → 33 days. Cross-border data harmonization via PMDA–EMA link cuts audit variance 42%. COGS variance per therapy declines 14%; patient access improves +26% regionwide. Collectively, USA–EU–APAC value frameworks achieve $19B payer savings by 2030. Distribution infrastructure matures—average claim turnaround 38 days, down from 72. Patient equity improves: inclusion of low-income groups up 19%. Multilateral agreements foster consistent thresholds—QALY acceptance bands converge around $160k–$175k. Quantitatively, the tri-region shift delivers a unified value-chain, with high-outcome predictability and improved capital efficiency.
Competitive Landscape
The competitive field consolidates into data-rich payers, pricing-tech vendors, and pharma alliances. Top ten pharma players capture 72% of immunotherapy revenue but lose 3.5 points of margin amid price transparency. Leaders—Roche, BMS, and Merck—pilot global value-based networks managing >400,000 patient lives. Pricing-tech platforms like Aetion, Prognos, and Komodo grow 35% CAGR, monetizing outcome validation APIs. Median implementation cost for digital contract infrastructure: $2.6M per payer, payback ≤ 2.8 years. AI-based pricing engines predict rebate risk with ±5% accuracy, cutting disputes 41%. Blockchain pilots at EMA and PMDA slash audit errors 38%. Pharma KPIs include adherence uplift ≥15%, claim-processing lag ≤45 days, and audit-clean pass ≥97%. By 2030, pharma risk exposure caps stabilize near 20%, aligning margin volatility below 2%. M&A rises—five major acquisitions annually—consolidating real-world data analytics into payers. Competitive differentiation centers on dataset credibility, KPI harmonization, and contract-execution automation. Market entrants offering turnkey validation ecosystems (pricing + outcome + audit) expand rapidly, growing 3.8× from 2025 to 2030. The net result is a mature, data-transparent, globally interoperable pricing ecosystem driving scalable access and predictable returns.
Report Details
Proceed To Buy
Want a More Customized Experience?
- Request a Customized Transcript: Submit your own questions or specify changes. We’ll conduct a new call with the industry expert, covering both the original and your additional questions. You’ll receive an updated report for a small fee over the standard price.
- Request a Direct Call with the Expert: If you prefer a live conversation, we can facilitate a call between you and the expert. After the call, you’ll get the full recording, a verbatim transcript, and continued platform access to query the content and more.
68 Circular Road, #02-01 049422, Singapore
Revenue Tower, Scbd, Jakarta 12190, Indonesia
4th Floor, Pinnacle Business Park, Andheri East, Mumbai, 400093
Cinnabar Hills, Embassy Golf Links Business Park, Bengaluru, Karnataka 560071
Request Custom Transcript
Related Transcripts
Clinical Nutrition Market Size & Share Analysis - Growth Trends & Forecasts (2025 - 2030)
This report quantifies the clinical nutrition market across the US and UK (2025–2030), covering enteral, parenteral, and oral nutritional supplements (ONS). Driven by aging populations, chronic disease prevalence, and hospital malnutrition protocols, market value rises from $18.5B (2025) → $30.2B (2030) at a CAGR of 10.2%. Growth is led by enteral nutrition (48% share), followed by ONS (38%) and parenteral (14%). Hospital digitization, AI-based nutrition screening, and reimbursement parity accelerate adoption. ROI averages 16–22% for integrated hospital nutrition programs.
$ 1395
$ 1395


68 Circular Road, #02-01 049422, Singapore
Revenue Tower, Scbd, No.52-53, Jakarta 12190, Indonesia
Cinnabar Hills, Embassy Golf Links Business Park, Bengaluru, Karnataka 560071
4th Floor, Pinnacle Business Park, Andheri East, Mumbai, 400093


68 Circular Road, #02-01 049422, Singapore
Revenue Tower, Scbd, Jakarta 12190, Indonesia
4th Floor, Pinnacle Business Park, Andheri East, Mumbai, 400093
Cinnabar Hills, Embassy Golf Links Business Park, Bengaluru, Karnataka 560071