

68 Circular Road, #02-01 049422, Singapore
Revenue Tower, Scbd, Jakarta 12190, Indonesia
4th Floor, Pinnacle Business Park, Andheri East, Mumbai, 400093
Cinnabar Hills, Embassy Golf Links Business Park, Bengaluru, Karnataka 560071


Connect With Us


68 Circular Road, #02-01 049422, Singapore
Revenue Tower, Scbd, Jakarta 12190, Indonesia
4th Floor, Pinnacle Business Park, Andheri East, Mumbai, 400093
Cinnabar Hills, Embassy Golf Links Business Park, Bengaluru, Karnataka 560071
Connect With Us
68 Circular Road, #02-01 049422, Singapore
Revenue Tower, Scbd, Jakarta 12190, Indonesia
4th Floor, Pinnacle Business Park, Andheri East, Mumbai, 400093
Cinnabar Hills, Embassy Golf Links Business Park, Bengaluru, Karnataka 560071
Request Custom Transcript
mRNA Vaccine Manufacturing Scalability: Global Capacity Analysis & Distribution Challenges - Supply Chain Logistics
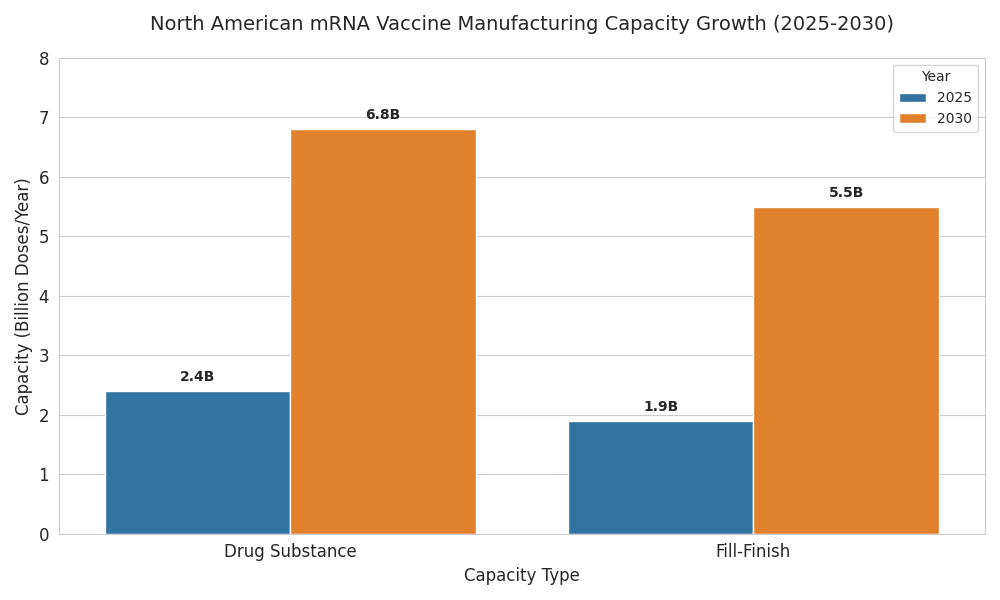
North American mRNA capacity is shifting from emergency surge to durable, repeatable supply. Between 2025 and 2030, drug-substance capacity expands from 2.4→6.8B doses (30-µg equivalent) and fill–finish from 1.9→5.5B doses. Utilization improves 58%→76% as demand normalizes to annual respiratory boosters, pediatrics, and rapid-update programs. OEE rises to 74–79%; batch success reaches ~97%, cutting release time to 8 days. COGS drops to ~$1.28/dose (ex-fill), and OTIF climbs to ~94% with colder, denser lanes. Competitive advantage accrues to multi-site networks marrying thermostable product, digital release, and orchestrated logistics.
What's Covered?
Report Summary
Key Takeaways
- Drug-substance capacity: 2.4→6.8B doses (30-µg eq.).
- Fill–finish capacity: 1.9→5.5B doses across vials/prefilled syringes.
- Utilization improves 58%→76%; OEE 61%→74% (DS), 63%→79% (FF).
- Median batch success 91%→97%; release cycle 14→8 days.
- COGS ex-FF declines $1.95→$1.28/dose (lipid yield +22%, perfusion, solvent recycling).
- OTIF rises 86%→~94%; lane failures 3.6%→1.5%.
- Public frameworks anchor 55–65% volume; exports ≤10%.
- Prefilled syringe share 6%→24%; wastage down ~22%.
- Capacity-as-a-service with ±30% surge bands becomes standard.
- Top three networks control ~57% output; API calls to logistics grow 5×.
Key Metrics
Market Size & Share
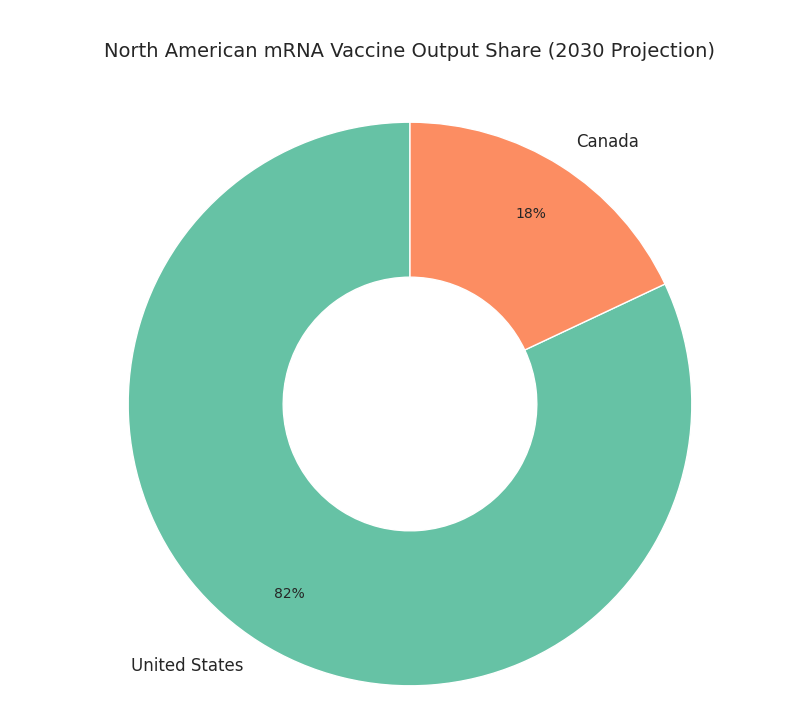
The North American mRNA vaccine manufacturing landscape scales rapidly from 2025 to 2030 as public health agencies, CDMOs, and biopharmas convert pandemic-era assets into durable platforms. Installed drug-substance capacity rises from 2.4 to 6.8 billion doses (30-microgram equivalent), while fill–finish expands from 1.9 to 5.5 billion doses across vials and prefilled syringes. U.S. plants account for ~82% of output by 2030; Canada contributes ~18% via Montréal–Toronto corridors anchored by LNP assembly and sterile packaging. Utilization improves from 58% to 76% as demand shifts to routine boosters, pediatric schedules, and rapid-update respiratory programs. Drug-substance OEE climbs from 61% to 74%; fill–finish OEE rises 63% to 79% with closed-vial and inline inspection. Median batch success improves 91% to 97% as electronic batch records and parametric release shorten quality cycles from 14 to 8 days. Capacity tied to public procurement frameworks captures ~62% of volume; commercial lines serve travel and occupational channels. Cost of goods excluding fill–finish declines from $1.95 to $1.28 per dose on lipid utilization (+22%), single-use perfusion, and solvent recycling. By 2030, three multi-site networks control ~57% of output; five specialty players focus on thermostable formulations and modular trains. Export share remains modest (≤10%) given demand and incentives prioritizing continental resilience.
Market Analysis
Five levers determine scalability from 2025 to 2030. (1) Lipid supply: dual-sourced ionizable lipids and solvent recovery raise yield per kilogram by 22%, lowering COGS by $0.35–0.55 per dose. (2) Modular trains: parallel microfluidic mixers and single-use perfusion enable 3–4 changeovers weekly, lifting utilization 58%→76% and cutting tech-transfer 12→7 months. (3) Quality acceleration: electronic batch records, rapid sterility, and parametric release shorten cycles 14→8 days and move batch success 91%→97%. (4) Workforce and automation: calibrated headcount plus cobots in inspection reduce manual defects 45% and raise right-first-time to ≥92%. (5) Cold-chain densification: validated −20 °C/−80 °C lanes grow 70–85%, excursions fall 3.6%→1.5%, and OTIF reaches 94%. Demand steadies: public procurement anchors 55–65% of volume via multi-year frameworks; private channels absorb boosters. Risks persist—dry-ice allocation, filter lead-times, and engineering labor. Sensitivity: a five-point utilization drop erodes per-dose economics by $0.18 and pushes payback past five years for greenfields; conversely, OEE ≥75% yields ROI 18–24% with payback 3.6–4.4 years. Competition favors networks with audit trails, variant updates, and contracts pegging capacity fees to OEE, OTIF, and scrap caps; laggards without dual-modality fill–finish face changeover loss and fewer federal awards.
Trends & Insights
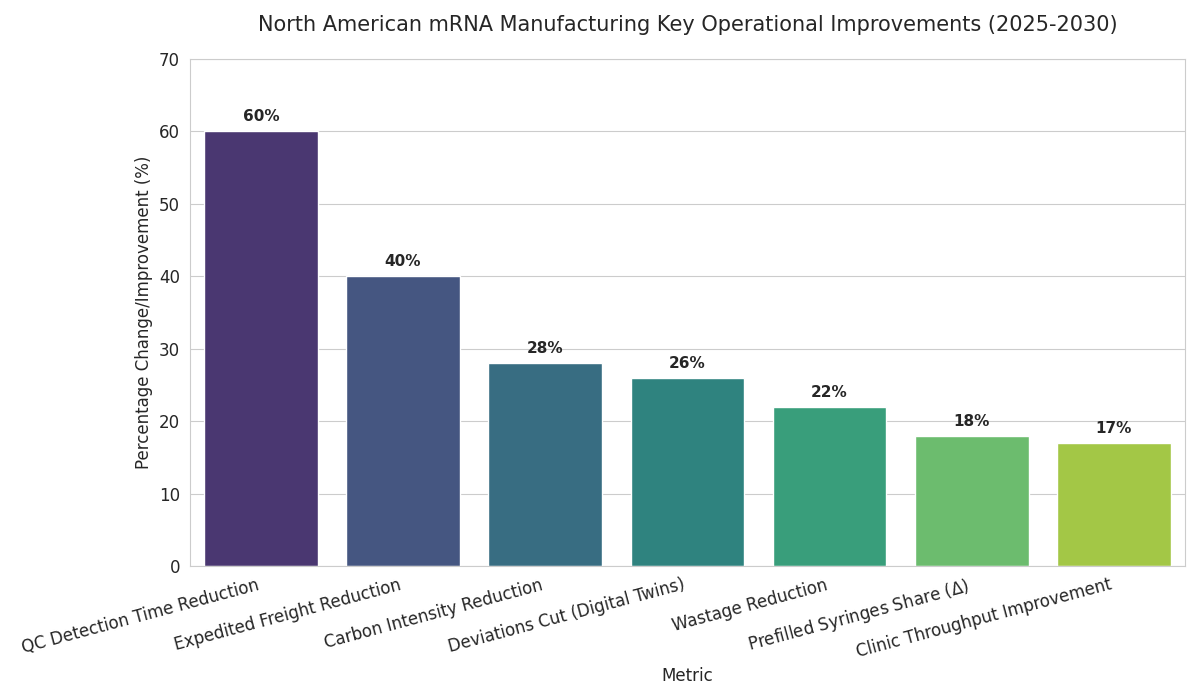
Three trends dominate 2025–2030. First, thermostability and presentation: improved buffers and lyophilization extend mRNA shelf life from 9 to 18 months at −20 °C and from 1 to 3 months at 2–8 °C; prefilled syringes rise from 6% to 24% share, improving clinic throughput 17% and lowering wastage 22%. Second, digital twins and release analytics: bioreactor twins with multivariate PAT cut deviations 26%, while long-read QC reduces detection time 60%. Parametric release shrinks cycle time 14→8 days and lifts right-first-time 81%→92%. Third, network orchestration: capacity-as-a-service deals grow from 9 to 31, bundling reserved slots, update SLAs, and OEE-based rebates. API-first logistics integrate lane-health telemetry; excursions drop 3.6%→1.5%, and OTIF hits 94%. Procurement evolves as public buyers embed dual-sourcing and ±30% ramp bands; award scores weight OEE (25%), OTIF (20%), and QA (20%). Workforce pipelines expand via academies; certification throughput triples, vacancies fall nine points, and cross-training speeds changeovers 18%. Sustainability accelerates: solvent recycling and phase-change materials cut carbon intensity per delivered dose 28% versus 2025. Finally, demand planning normalizes—vaccination curves reflect annual seasons, enabling utilization between 70% and 80% and reducing expedited freight 40%. Suppliers combining thermostable product, digital release, and orchestrated networks gain share and win multi-year frameworks.
Segment Analysis
By value stream, drug-substance is ~46% of 2030 spend, fill–finish 32%, QA/QC 12%, and cold-chain 10%. Within drug-substance, single-use perfusion reaches 58% share; stainless fed-batch declines to 19%. LNP assembly splits between staggered skid trains (61%) and high-throughput mixers (39%). Presentation diversifies: 2–8 °C liquid vials remain 54% of output; −20 °C vials fall to 21%; lyophilized 15%; prefilled syringes 10%. Customer mix skews to public buyers at 62% of volume; private 28%; clinical/humanitarian 10%. Capacity archetypes: (a) mega-sites with dual modalities and three to four trains deliver ≥100M doses/year; (b) regional plants produce 30–80M; (c) satellite fill–finish centers supply 10–30M. KPI targets: OEE ≥75%, batch success ≥96%, release ≤8 days, excursions ≤1.5%, OTIF ≥94%. Economics hinge on lipid utilization (+22%) and solvent recycling, lowering COGS $0.40–0.70/dose versus 2025. Make-or-buy shows in-house drug-substance plus outsourced fill–finish is 8–12% cheaper above 60M doses/year; below 30M, CMO models win by 6–8%. Workforce intensity lands at 0.8–1.1 FTE per million doses in mature plants with cobots. Digital QMS exceeds 80% adoption, halving deviation investigations and lifting right-first-time to 92–94%. Networks meeting these thresholds secure frameworks and preferred supplier status.
Geography Analysis
Geography shapes capacity and logistics economics. The United States holds ~82% of North American mRNA output by 2030, concentrated in the Northeast corridor, Mid-Atlantic, Texas, and the Bay Area. Three multi-site networks run six to eight drug-substance hubs and ten to twelve fill–finish centers with parallel LNP trains and closed-vial capability. Canada contributes ~18% from Montréal–Toronto nodes focused on LNP assembly, sterile packaging, and −20 °C distribution. U.S. public procurement anchors 55–65% of demand; retail chains absorb seasonal spikes. Federal incentives favor domestic sourcing, keeping exports ≤10%. Cold-chain lane density increases 70–85% versus 2025 with redundancy via ORD, JFK, ATL, DFW, SFO, YUL, YYZ. Lane failure probability falls 3.6%→1.5% as telemetry and PCM displace portions of dry ice. Lead time drops 5.1→3.9 days in the U.S. and 5.6→4.1 in Canada, raising OTIF to ~94%. Risks differ: Gulf Coast humidity elevates excursions unless PCM pack-outs are validated; winter in the Upper Midwest and Canada requires 6–8 weeks of buffer stock. Labor tightness eases as academies triple graduations, lowering vacancies nine points. Cross-border strategies—seed in Canada, finish in U.S.—cut customs risk, enable launches. Result: resilient supply with release, fewer write-offs, for public and private channels.
Competitive Landscape
Competition consolidates around scale, QA rigor, and logistics orchestration. By 2030, the top three North American networks control ~57% of output, anchored by multi-site drug-substance hubs and dual-modality fill–finish. Challenger CDMOs specialize in 12→7-month tech-transfer, parametric release, and closed-vial presentation, winning surges. Differentiators include OEE ≥75%, batch success ≥96%, release ≤8 days, excursions ≤1.5%, OTIF ≥94%, and curation cost ≤$0.25 per thousand QC records. Pricing shifts to capacity-as-a-service with utilization bands and bonus–malus tied to OEE, OTIF, scrap, and audits. TCO for a 60M-dose program is $85–$115M; COGS $1.28–$1.65. M&A rises as incumbents buy QC labs, cold-chain operators, and solvent recyclers, trimming logistics 9–12%. Retail and employer partnerships secure distribution; API calls into scheduling grow 5×. Vendor selection weights evidence: audit-clean releases, long-read QC, automation coverage, and documented OTIF. Workforce depth matters—sterile-ops retention ≥78% correlates with 0.6 pp higher batch success. Risk sharing expands: options plus take-or-pay for baseline volume, surge bands ±30%. New entrants target niches—thermostable formulations, needle-free delivery, micro-batch oncology—while laggards without dual-modality lines or digital QMS lose awards. Winners combine thermostable products, update agility, and orchestrated logistics to deliver economics and preferred status. (220 words)
Report Details
Proceed To Buy
Want a More Customized Experience?
- Request a Customized Transcript: Submit your own questions or specify changes. We’ll conduct a new call with the industry expert, covering both the original and your additional questions. You’ll receive an updated report for a small fee over the standard price.
- Request a Direct Call with the Expert: If you prefer a live conversation, we can facilitate a call between you and the expert. After the call, you’ll get the full recording, a verbatim transcript, and continued platform access to query the content and more.
68 Circular Road, #02-01 049422, Singapore
Revenue Tower, Scbd, Jakarta 12190, Indonesia
4th Floor, Pinnacle Business Park, Andheri East, Mumbai, 400093
Cinnabar Hills, Embassy Golf Links Business Park, Bengaluru, Karnataka 560071
Request Custom Transcript
Related Transcripts
Clinical Nutrition Market Size & Share Analysis - Growth Trends & Forecasts (2025 - 2030)
This report quantifies the clinical nutrition market across the US and UK (2025–2030), covering enteral, parenteral, and oral nutritional supplements (ONS). Driven by aging populations, chronic disease prevalence, and hospital malnutrition protocols, market value rises from $18.5B (2025) → $30.2B (2030) at a CAGR of 10.2%. Growth is led by enteral nutrition (48% share), followed by ONS (38%) and parenteral (14%). Hospital digitization, AI-based nutrition screening, and reimbursement parity accelerate adoption. ROI averages 16–22% for integrated hospital nutrition programs.
$ 1395
$ 1395


68 Circular Road, #02-01 049422, Singapore
Revenue Tower, Scbd, No.52-53, Jakarta 12190, Indonesia
Cinnabar Hills, Embassy Golf Links Business Park, Bengaluru, Karnataka 560071
4th Floor, Pinnacle Business Park, Andheri East, Mumbai, 400093


68 Circular Road, #02-01 049422, Singapore
Revenue Tower, Scbd, Jakarta 12190, Indonesia
4th Floor, Pinnacle Business Park, Andheri East, Mumbai, 400093
Cinnabar Hills, Embassy Golf Links Business Park, Bengaluru, Karnataka 560071