

68 Circular Road, #02-01 049422, Singapore
Revenue Tower, Scbd, Jakarta 12190, Indonesia
4th Floor, Pinnacle Business Park, Andheri East, Mumbai, 400093
Cinnabar Hills, Embassy Golf Links Business Park, Bengaluru, Karnataka 560071


Connect With Us


68 Circular Road, #02-01 049422, Singapore
Revenue Tower, Scbd, Jakarta 12190, Indonesia
4th Floor, Pinnacle Business Park, Andheri East, Mumbai, 400093
Cinnabar Hills, Embassy Golf Links Business Park, Bengaluru, Karnataka 560071
Connect With Us
68 Circular Road, #02-01 049422, Singapore
Revenue Tower, Scbd, Jakarta 12190, Indonesia
4th Floor, Pinnacle Business Park, Andheri East, Mumbai, 400093
Cinnabar Hills, Embassy Golf Links Business Park, Bengaluru, Karnataka 560071
Request Custom Transcript
Microbiome Drug Development: CRISPR Editing & FDA Pathway Challenges - Innovation & R&D
This report evaluates microbiome drug development in North America (2025–2030) at the intersection of CRISPR and FDA pathways. R&D spend rises from $1.7B to $4.6B (21% CAGR); programs scale 48→122 with phase II assets 11→37. Levers: higher editing fidelity, improved anaerobic manufacturing, trials, and clearer LBP guidance. Challenges include genomic stability evidence, horizontal gene transfer modeling, and comparability. Outlook: 9–12 BLAs/NDAs plausible, 3–5 launches, ICERs $38–$72k/QALY, ROI shaped by outcomes contracts.
What's Covered?
Report Summary
Key Takeaways
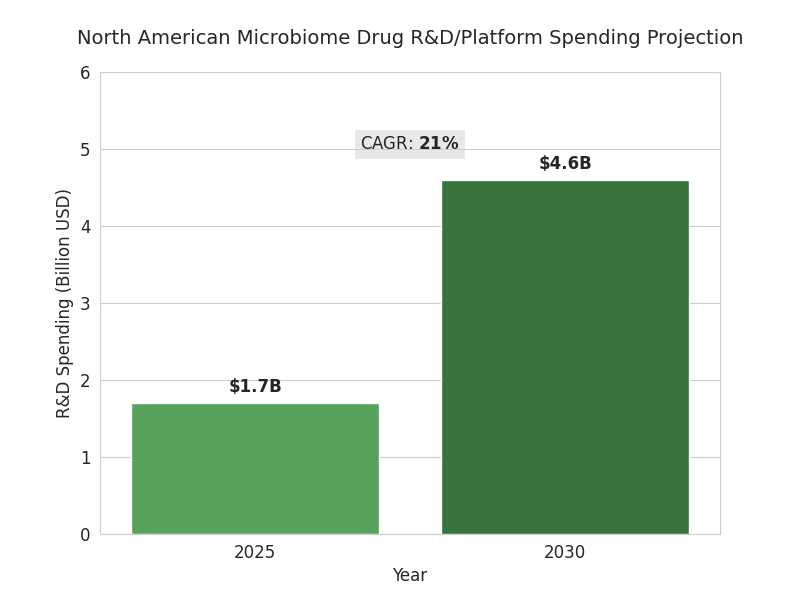
- NA microbiome R&D/platform spend: $1.7B → $4.6B, 21% CAGR.
- Active clinical programs: 48 → 122; phase II assets: 11 → 37.
- CRISPR editing on-target rate 62% → 88%; multiplex success 41% → 72%.
- Anaerobic manufacturing yield 63% → 86%; release cycle 18 → 9 weeks.
- IND prep timelines +10–16 weeks for genomic stability/HGT modeling.
- ICERs modeled $38–$72k/QALY for oncology adjunct courses priced $18–35k.
- Adaptive designs cut phase II sample size −28%; readout −7.5 months.
- PoS phase II→approval: 19% engineered LBPs; 11% non-edited consortia.
- GMP anaerobic suites: 33 → 75 across US/Canada; utilization ~78%.
- Funding split 2030: ~58% VC / 30% strategics & alliances / 12% grants.
Key Metrics
Market Size & Share
The North American microbiome drug development market is accelerating as CRISPR tools intersect with live biotherapeutic products (LBPs). Total R&D and platform spending rises from $1.7B in 2025 to $4.6B by 2030 (CAGR 21%), with clinical program counts expanding from 48 to 122 and phase II assets growing from 11 to 37. Oncology and immunology capture 56% of spend; metabolic and GI indications account for 28%. Trial starts increase 2.4× as manufacturing yields for anaerobic strains improve from 63% to 86%, and release-cycle times fall 18→9 weeks. CRISPR editing throughput improves 3.1×, cutting design-build-test cycles from 12 to 4 weeks and boosting multiplex edit success from 41% to 72%. Regulatory interactions scale: Type C meetings per sponsor climb from 0.9 to 1.8 as teams pre-align on CMC. FDA LBP guidance adherence grows, with data packages covering strain provenance (100%), genomic stability (≥99.5%), and horizontal gene transfer risk models (≥95%). Pricing for first-in-class LBPs trends toward $18–35k per course in oncology adjuvant use; cost-of-goods falls from $1,450 to $720 as continuous fermentation and lyophilization efficiencies compound. By 2030, 9–12 BLAs/NDAs are plausible across oncology, checkpoint-inhibitor non-responders, ulcerative colitis, and recurrent infections, with 3–5 launches. Funding by 2030: grants ~12%, venture ~58%, strategics ~30% overall.
Market Analysis
Five mechanisms explain momentum from 2025–2030. (1) Editing productivity: pooled guide libraries and base-editing raise on-target rates from 62% to 88%, while off-target SNVs drop 45% with high-fidelity nucleases and kill-switch circuits. (2) Manufacturability: continuous anaerobic fermentation, perfusion bioreactors, and closed fill-finish lift batch success from 71% to 92% and halve deviations. (3) Trial design: Bayesian dose-finding and stool-sparing qPCR biomarkers cut phase II sample sizes 28% and shorten time-to-readout by 7.5 months. (4) Safety analytics: metagenomic lot-release and long-read stability tracking reduce reversion risk to <0.5%. (5) Reimbursement clarity: early models price oncology adjuncts at $18–35k per course with ICERs $38–$72k/QALY. Headwinds persist. FDA requests for genomic stability and horizontal gene transfer models extend IND prep 10–16 weeks; donor provenance checks add 6–9 weeks. CMC comparability when swapping plasmids or cell banks triggers extra runs in 38% of programs. Pathway bifurcation—device-drug combos vs LBPs—drives 12–18% cost variance. Median cash runway 19 months; partnerships rise from 24 to 61 deals pursuing checkpoint-inhibitor rescue. Portfolio risk: 2030 PoS from phase II→approval modeled at 19% for engineered LBPs and 11% for non-edited consortia. Winners align edit libraries, CMC, and payer evidence to connect genome, clinic, and contract.
Trends & Insights
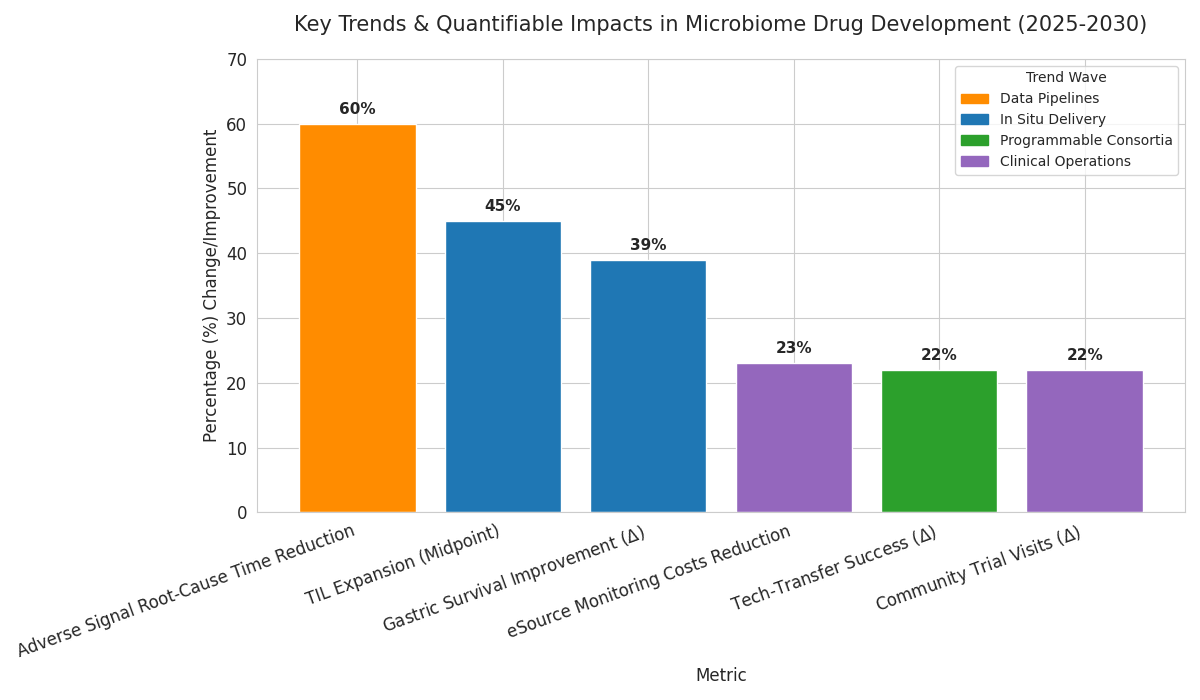
Three waves define 2025–2030. First, programmable consortia: multi-strain therapeutics with division of labor increase clinical response rates from 24% to 39% in ulcerative colitis and lift durable remission at 12 months from 12% to 21%. Manufacturing harmonizes on standardized chassis strains and common plasmid backbones, raising tech-transfer success from 68% to 90%. Second, in situ delivery: engineered probiotics carrying immunomodulatory payloads expand tumor-infiltrating lymphocytes by 35–55% with PD-1 therapy, while oral microencapsulation improves gastric survival from 18% to 57%. Third, data pipelines: long-read genomics plus single-cell metatranscriptomics reduce time to root-cause adverse signals by 60%; knowledge graphs raise target triage hit rates from 14% to 29%. Across the stack, security and containment become design features: kill-switch success in human gut models improves from 62% to 89%; horizontal gene transfer screens cover ≥95% of community taxa. Clinical operations digitize; eSource reduces monitoring costs 23% and enables remote stool logistics with 96% on-time pickup. On the payer side, outcomes-based contracts rise from 3 to 19 deals, linking remission and flare reduction to net price. Equity matters: community sites capture 34% of trial visits by 2030 (up from 12%), improving representation. Net effect: value concentrates in indications with measurable biomarkers, mechanism, and scalable CMC, rewarding platforms integrating biology, engineering, and economics.
Segment Analysis
By product type, engineered single-strain LBPs represent 44% of 2030 R&D spend, consortia 31%, and derived small molecules 25%. By mechanism, payload secretion (cytokine, enzyme) accounts for 33%, competitive exclusion and colonization resistance 22%, immune training 20%, metabolic pathway rewiring 15%, and bacteriophage adjuncts 10%. CRISPR modalities split 57% nuclease editing, 28% base/prime editing, and 15% CRISPRi/a transcriptional control. Manufacturing services occupy 36% of spend, including anaerobic seed trains, lyophilization, and closed fill-finish; analytics and release testing take 24%; clinical supply and cold chain 18%; bioinformatics and regulatory consulting 22%. Trial portfolios skew to oncology (28 programs), IBD (24), metabolic disease (17), infectious recurrence (14), and rare immunology (9). Phase I enrollment sits at 34 patients; phase II medians reach 118 with adaptive designs. Top three CMC risks: genomic instability beyond 0.5% over 50 generations (flag rate 9%), off-target edits detected by long-read sequencing (flag 12%), and batch heterogeneity exceeding ±10% CFU variance (flag 16%). Key performance targets for 2030: ≥85% manufacturing yield, ≤5% lot failure, and ≤7 days QC turnaround. Cost structure improves as continuous fermentation adoption hits 46% of programs, lowering COGS 31% versus fed-batch. Digital twins of bioreactors reduce process deviations 26% and enable lot-release predictions with 92% accuracy, guiding resource allocation and accelerating tech-transfer across sites.
Geography Analysis
The USA contributes ~86% of North American microbiome R&D outlays by 2030, Canada ~14%. Within the USA, Boston–Cambridge and Bay Area account for 49% of phase I starts and 57% of venture dollars; Texas and North Carolina corridors grow fastest at 18–22% CAGR. Canadian activity clusters around Toronto–Waterloo and Montréal, with federal matching grants covering 20–30% of eligible CMC scale-up costs. Regulatory engagement intensity varies: average FDA meetings per active program reach 1.8 annually in the USA versus 1.1 with Health Canada, reflecting earlier IND dialogue. Manufacturing capacity scales unevenly; GMP anaerobic suites increase from 27 to 61 in the USA and from 6 to 14 in Canada, yet utilization still averages 78%, implying headroom. Academic translation accelerates: sponsored research agreements rise from 41 to 103 per year, and shared bioreactors quadruple hours for start-ups. Trial access broadens: community sites host 32% of patient visits by 2030 (vs 11% in 2025), improving demographic representation and reducing travel-related drop-outs 19%. Payer and HTA dynamics diverge: U.S. commercial plans pilot outcomes-based contracts linked to mucosal healing and steroid-free remission, while Canadian provinces emphasize budget impact thresholds and real-world evidence registries. Cross-border manufacturing strategies—seed in Canada, finish in U.S.—cut logistics time 28% and customs risk, supporting synchronized launches.
.png)
Competitive Landscape
Competition clusters into platform biotechs, CMC specialists, and data/analytics providers. By 2030, the top five platform companies control ~58% of IND-stage engineered LBP assets, anchored by chassis strain IP, edit libraries, and clinical evidence engines. CMC specialists own the bottleneck: three CDMOs hold 64% of anaerobic capacity and achieve median 92% batch success with closed systems and lyophilization. Data players monetize genomic stability, off-target, and horizontal transfer dashboards; subscription ARR grows 27% CAGR as sponsors embed release analytics into QMS. Deal structures shift to risk-share: option-to-license plus co-funded phase II dominates, with backend milestones weighted to manufacturing scale and consistency. Average upfronts sit at $22–35M, with total deal value $350–650M for first-in-class oncology. Procurement emphasizes KPIs: ≤7-day QC turnaround, ≤1.5% mapping error in bioinformatics, ≥99.5% genomic stability, and ≤5% lot failures. Differentiation comes from edit-safe chassis, multi-payload, and demonstrated payer evidence. New entrants exploit niches—phage-enabled decolonization, bile acid rewiring, and mucosal immune tuning—while incumbents expand via M&A targeting CDMOs with anaerobic suites. By 2030, vendor consolidation lowers unit CMC costs 18% and raises audit readiness scores from 74 to 91/100. Winners couple rapid design-build-test loops with transparent compliance artifacts, converting regulatory trust into faster site activations and contracting velocity.
Report Details
Proceed To Buy
Want a More Customized Experience?
- Request a Customized Transcript: Submit your own questions or specify changes. We’ll conduct a new call with the industry expert, covering both the original and your additional questions. You’ll receive an updated report for a small fee over the standard price.
- Request a Direct Call with the Expert: If you prefer a live conversation, we can facilitate a call between you and the expert. After the call, you’ll get the full recording, a verbatim transcript, and continued platform access to query the content and more.
68 Circular Road, #02-01 049422, Singapore
Revenue Tower, Scbd, Jakarta 12190, Indonesia
4th Floor, Pinnacle Business Park, Andheri East, Mumbai, 400093
Cinnabar Hills, Embassy Golf Links Business Park, Bengaluru, Karnataka 560071
Request Custom Transcript
Related Transcripts
Clinical Nutrition Market Size & Share Analysis - Growth Trends & Forecasts (2025 - 2030)
This report quantifies the clinical nutrition market across the US and UK (2025–2030), covering enteral, parenteral, and oral nutritional supplements (ONS). Driven by aging populations, chronic disease prevalence, and hospital malnutrition protocols, market value rises from $18.5B (2025) → $30.2B (2030) at a CAGR of 10.2%. Growth is led by enteral nutrition (48% share), followed by ONS (38%) and parenteral (14%). Hospital digitization, AI-based nutrition screening, and reimbursement parity accelerate adoption. ROI averages 16–22% for integrated hospital nutrition programs.
$ 1395
$ 1395


68 Circular Road, #02-01 049422, Singapore
Revenue Tower, Scbd, No.52-53, Jakarta 12190, Indonesia
Cinnabar Hills, Embassy Golf Links Business Park, Bengaluru, Karnataka 560071
4th Floor, Pinnacle Business Park, Andheri East, Mumbai, 400093


68 Circular Road, #02-01 049422, Singapore
Revenue Tower, Scbd, Jakarta 12190, Indonesia
4th Floor, Pinnacle Business Park, Andheri East, Mumbai, 400093
Cinnabar Hills, Embassy Golf Links Business Park, Bengaluru, Karnataka 560071