

68 Circular Road, #02-01 049422, Singapore
Revenue Tower, Scbd, Jakarta 12190, Indonesia
4th Floor, Pinnacle Business Park, Andheri East, Mumbai, 400093
Cinnabar Hills, Embassy Golf Links Business Park, Bengaluru, Karnataka 560071


Connect With Us


68 Circular Road, #02-01 049422, Singapore
Revenue Tower, Scbd, Jakarta 12190, Indonesia
4th Floor, Pinnacle Business Park, Andheri East, Mumbai, 400093
Cinnabar Hills, Embassy Golf Links Business Park, Bengaluru, Karnataka 560071
Connect With Us
68 Circular Road, #02-01 049422, Singapore
Revenue Tower, Scbd, Jakarta 12190, Indonesia
4th Floor, Pinnacle Business Park, Andheri East, Mumbai, 400093
Cinnabar Hills, Embassy Golf Links Business Park, Bengaluru, Karnataka 560071
Request Custom Transcript
Metaverse Store Design: Virtual Reality Architecture & Conversion Rate Optimization Strategies
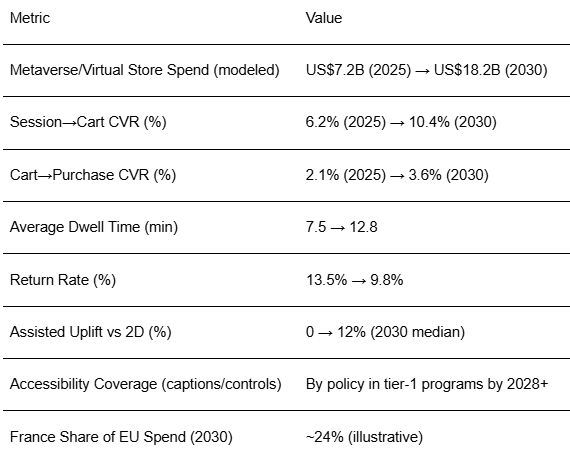
Europe’s metaverse retail is exiting experimentation and entering performance design. From 2025–2030, brands move beyond one‑off virtual showrooms to VR stores architected for discovery, assisted selling, and checkout speed. We model EU spend on metaverse/virtual store infrastructure and commerce capabilities rising from ~US$7.2B in 2025 to ~US$18.2B by 2030, led by fashion, luxury, beauty, home, and auto accessories. France stands out with strong cultural institutions, luxury maisons, and creative studios that translate brand worlds into measurable outcomes. Performance hinges on architecture and CRO discipline. Architecture: spatial taxonomies (foyers → galleries → try‑zones → checkout), locomotion choices (teleport vs smooth), and accessibility (seated paths, subtitles, gamepad/webXR parity). CRO: scene‑level A/B tests for pathing and prompts; SKU clustering by task; avatar‑led assistance; and trust frictions removed (clear pricing, returns, provenance).

What's Covered?
Report Summary
Key Takeaways
1. Architecture is strategy: spatial flows, locomotion, and accessibility determine conversion.
2. CRO at scene level: test prompts, pathing, and assistance; stream events to dashboards.
3. Asset discipline (LOD, occlusion, budgets) keeps FPS high and drop‑offs low.
4. Assisted selling (avatar/video chat) lifts CVR use sparingly with clear triggers.
5. Trust and clarity: transparent pricing, returns, and provenance reduce bounce and refunds.
6. Wallets & loyalty: interoperable perks convert attention into repeat purchase.
7. France advantage: creative studios + luxury maisons drive high‑production VR stores.
8. Governance: privacy, safety, and accessibility are non‑negotiable in EU contexts.
Key Metrics
Market Size & Share
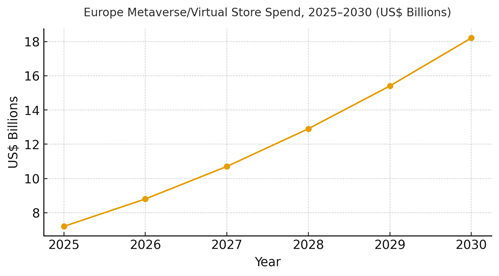
EU metaverse/virtual store spend is modeled to grow from ~US$7.2B (2025) to ~US$18.2B (2030). Fashion, luxury, beauty, and home lead value creation, with auto accessories and electronics showrooms adding experiential depth. France contributes ~24% of EU spend by 2030, reflecting luxury density and creative production capacity. The line figure shows the compounded growth trajectory.
Share dynamics: early wins come from categories with fit/scale benefits (furniture, footwear) and high narrative value (luxury, beauty). As engines and webXR performance improve, mid‑market retailers adopt templated stores with strong CRO baselines. Execution risks include device fragmentation, content costs, and inconsistent analytics. To gain share, brands standardize content pipelines (PBR shaders, asset budgets), instrument scenes for analytics, and treat VR stores as performance products, not campaigns.
Market Analysis
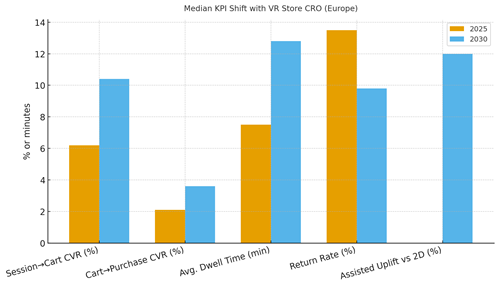
Conversion optimization in VR requires a new metric stack. We model session→cart CVR improving from ~6.2% to ~10.4%, cart→purchase from ~2.1% to ~3.6%, dwell time from ~7.5 to ~12.8 minutes, and return rates dropping from ~13.5% to ~9.8% by 2030 when CRO is systematic. Enablers: scene analytics (pathing, heatmaps), asset budgets that keep FPS high, guided flows with optional assistance, and trust signals (pricing, returns, provenance) placed at decision nodes. The bar chart summarizes the directional shifts. Barriers include headset friction, motion sickness, and production cost; mitigations include teleport locomotion defaults, comfort settings, and reusable modular sets.
Financial lens: attribute incremental margin after returns vs 2D store baselines; account for production amortization; and track assisted‑selling cost. Vendor strategy: modular stacks across engines (Unity/Unreal/WebXR), edge/CDN, analytics, identity/wallets, and payments.
Trends & Insights
1) Performance architecture: spatial taxonomies and asset budgets treated like web core vitals. 2) Social presence: co‑shopping and events with voice/text drive dwell and conversion enable moderation. 3) Try‑before‑you‑buy: physics/scale‑accurate previews and photogrammetry reduce returns. 4) Guided journeys: avatar/staff assistance by request; second‑screen chat for web visitors. 5) Loyalty in‑world: quests and stamps tied to wallets unlock perks. 6) Provenance & trust: material authenticity, repair policies, and secure payments surface early. 7) Accessibility: seated paths, captions, and comfort modes as default. 8) Content reuse: modular sets and PBR pipelines lower unit costs. 9) Interop: portable identities and assets across partner events. 10) Measurement discipline: scene‑level tests, holdouts vs 2D, and ROI tied to incremental margin after returns.
Segment Analysis
Luxury & Fashion: Narrative galleries, try‑zones, personalization, and concierge chat. Beauty: Shade finders, regimen builders, and sampling tokens. Home & Furniture: Scale‑accurate placement; AR/VR bridges; delivery/configuration clarity. Electronics & Auto Accessories: Feature demos and compatibility assistants. Sports & Footwear: Fit guidance and gait visualizations. Across segments, define CRO guardrails (prompt density, assistance triggers), measure per‑segment CVR and return rates, and allocate production budgets to reusable modular sets.
Geography Analysis
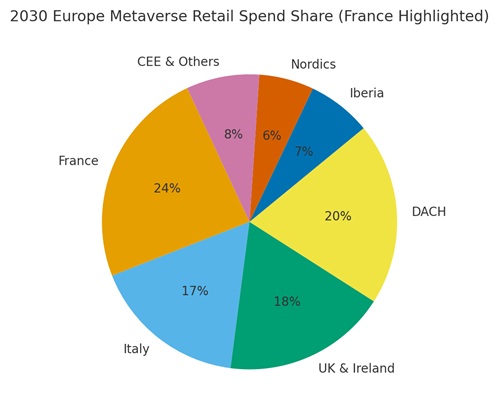
France is projected to hold ~24% of EU metaverse retail spend by 2030, alongside DACH (~20%), UK & Ireland (~18%), Italy (~17%), Iberia (~7%), Nordics (~6%), and CEE & Others (~8%). France’s strengths: luxury maisons, creative studios, and cultural venues suited to experiential launches. Localization principles: French language assets, accessibility compliance, and local payments. The pie figure reflects France’s leadership within Europe’s metaverse retail mix.
Execution: centralize content pipelines and analytics; let local teams run cultural collaborations and service menus. Track geography‑specific KPIs (session→cart, cart→purchase, dwell, returns) and adjust asset budgets and assistance cadences accordingly.
Competitive Landscape
Incumbents: luxury maisons and big retailers with internal creative tech; Challengers: specialized VR agencies, WebXR platforms, and creator studios. Differentiation vectors: (1) performance architecture and FPS reliability, (2) scene analytics and CRO discipline, (3) accessible design and safety, (4) wallet/loyalty interoperability, and (5) modular content pipelines. Procurement: demand APIs, scene analytics, SLAs for performance/uptime, and proof of incremental margin vs 2D baselines. Winners in 2025–2030 will treat VR stores as living products measured, iterated, and integrated with clienteling and logistics.
Report Details
Proceed To Buy
Want a More Customized Experience?
- Request a Customized Transcript: Submit your own questions or specify changes. We’ll conduct a new call with the industry expert, covering both the original and your additional questions. You’ll receive an updated report for a small fee over the standard price.
- Request a Direct Call with the Expert: If you prefer a live conversation, we can facilitate a call between you and the expert. After the call, you’ll get the full recording, a verbatim transcript, and continued platform access to query the content and more.
68 Circular Road, #02-01 049422, Singapore
Revenue Tower, Scbd, Jakarta 12190, Indonesia
4th Floor, Pinnacle Business Park, Andheri East, Mumbai, 400093
Cinnabar Hills, Embassy Golf Links Business Park, Bengaluru, Karnataka 560071
Request Custom Transcript
Related Transcripts

$ 1395


68 Circular Road, #02-01 049422, Singapore
Revenue Tower, Scbd, No.52-53, Jakarta 12190, Indonesia
Cinnabar Hills, Embassy Golf Links Business Park, Bengaluru, Karnataka 560071
4th Floor, Pinnacle Business Park, Andheri East, Mumbai, 400093


68 Circular Road, #02-01 049422, Singapore
Revenue Tower, Scbd, Jakarta 12190, Indonesia
4th Floor, Pinnacle Business Park, Andheri East, Mumbai, 400093
Cinnabar Hills, Embassy Golf Links Business Park, Bengaluru, Karnataka 560071