

68 Circular Road, #02-01 049422, Singapore
Revenue Tower, Scbd, Jakarta 12190, Indonesia
4th Floor, Pinnacle Business Park, Andheri East, Mumbai, 400093
Cinnabar Hills, Embassy Golf Links Business Park, Bengaluru, Karnataka 560071


Connect With Us


68 Circular Road, #02-01 049422, Singapore
Revenue Tower, Scbd, Jakarta 12190, Indonesia
4th Floor, Pinnacle Business Park, Andheri East, Mumbai, 400093
Cinnabar Hills, Embassy Golf Links Business Park, Bengaluru, Karnataka 560071
Connect With Us
68 Circular Road, #02-01 049422, Singapore
Revenue Tower, Scbd, Jakarta 12190, Indonesia
4th Floor, Pinnacle Business Park, Andheri East, Mumbai, 400093
Cinnabar Hills, Embassy Golf Links Business Park, Bengaluru, Karnataka 560071
Request Custom Transcript
Live Commerce Conversion Science: Real-Time Analytics & Gamification Tactics for D2C Brands
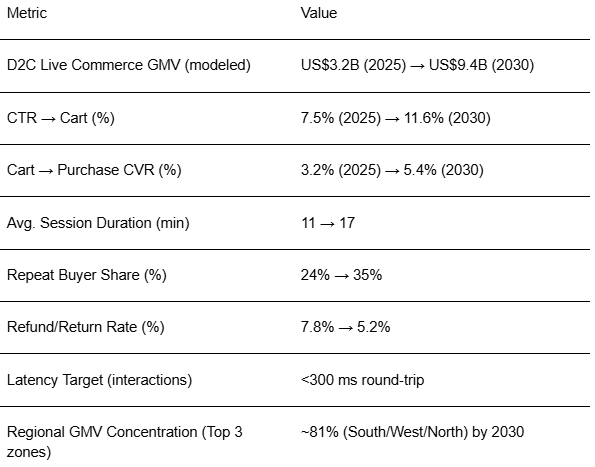
India’s D2C brands are turning live commerce from a campaign novelty into a conversion engine. The 2025–2030 stack fuses (1) real‑time analytics stream event ingestion, cohorting, and next‑best‑action; (2) gamification quests, streaks, team goals, drop timers, and limited‑slot rewards; and (3) shopper ops creator workflows, post‑live retargeting, and refund friction control. We model India’s D2C live‑commerce GMV expanding from ~US$3.2B in 2025 to ~US$9.4B by 2030, with growth concentrated in fashion/beauty, electronics accessories, home, and specialty foods. The lever is not volume of streams it’s conversion science at the second‑by‑second level. Operationally, winning teams build an event fabric view, hover, chat, click, add‑to‑cart, checkout that powers live segmentation and micro‑offers.
What's Covered?
Report Summary
Key Takeaways
1. Conversion science beats volume: optimize second‑by‑second micro‑offers and overlays.
2. Event fabrics power real‑time cohorts; test anchor styles, prompts, and offer timing weekly.
3. Gamification needs utility: streaks, quests, and team goals must unlock relevant value.
4. Latency budgets and mobile‑first UI are decisive for India’s viewing conditions.
5. Creator workflows & compliance standardization raise quality and trust.
6. Post‑live highlights fuel retargeting; scene‑level assets drive ROAS in DPA/RMN.
7. Measure CTR→cart, CVR, session minutes, repeat buyer share, and refund rate with holdouts.
8. Governance: transparent incentives, disclosure, and minor protection are non‑negotiable.
Key Metrics
Market Size & Share
India’s D2C live commerce GMV is modeled to expand from ~US$3.2B (2025) to ~US$9.4B (2030), propelled by mobile‑first audiences, regional‑language content, creator ecosystems, and integrated payments. Share concentrates in fashion/beauty followed by home and specialty foods; consumer electronics accessories and fitness also scale. Platforms diversify: brand‑owned stores, marketplace live channels, and social platforms with native checkout. The line figure depicts the compounding growth trajectory.
Share dynamics: South (Bengaluru/Chennai/Hyderabad) and West (Mumbai/Pune/Ahmedabad) outpace other regions due to creator supply and logistics; North (Delhi‑NCR) contributes strong absolute GMV. Tier‑2/3 cities expand as vernacular content and COD/UPI parity improve. Leaders win share by building content calendars with drop cadence, enforcing metadata standards at the scene level, and connecting live signals to CRM and RMN campaigns. Execution risks include latency spikes, stockout‑induced cart abandonment, and refund friction. Guardrails: cap prompts per minute, pre‑stage inventory, and disclose incentives for ethical engagement.

Market Analysis
Conversion and engagement KPIs respond materially to real‑time analytics paired with purposeful game loops. We model median CTR→cart improving from ~7.5% to ~11.6%, cart→purchase CVR from ~3.2% to ~5.4%, session duration from ~11 to ~17 minutes, repeat buyer share from ~24% to ~35%, and refund rate dropping from ~7.8% to ~5.2% by 2030. Enablers: event fabrics that capture watch, chat, click, and add‑to‑cart signals; <300 ms decisioning for overlays; and catalogs of micro‑offers that respect margin. Gamification works when it reinforces shopping intent missions tied to discovery, sampling, or bundles rather than distracting minigames. Barriers: creative throughput, latency on lower‑end devices, and inventory mismatches.
Financial lens: optimize to incremental gross margin after incentives and returns, not just CVR. Use holdouts and intent‑matched cohorts to attribute uplift; stage‑gate experiments on prompt density, anchor formats, and offer timing. Vendor strategy: modular stack across player/interactivity, analytics, payments, and anti‑fraud. The bar chart summarizes directional KPI shifts with analytics + gamification at scale.

Trends & Insights
1) Vernacular live: regional‑language anchors expand reach and conversion; subtitles and voiceover matter. 2) Utility‑first gamification: quests and team goals unlock relevant perks (samples, size exchanges, free installs) rather than abstract points. 3) Scene‑level experimentation: thumbnails, overlays, and anchors are tested continuously; winning variants roll forward. 4) Post‑live flywheel: clips feed DPA/RMN and email/SMS retargeting; creator content becomes evergreen. 5) Latency engineering: edge delivery and lightweight overlays keep round‑trip under 300 ms. 6) Sizing & configuration aids: reduce refunds in fashion/electronics. 7) Creator ops: briefs, compliance, and studio kits standardize quality. 8) Trust & safety: disclosure, moderation, and minor protection with purchase limits. 9) Payments: UPI + BNPL nudge higher AOV; COD parity in Tier‑2/3. 10) Attribution rigor: geo holdouts and cohort matching separate hype from real lift.
Segment Analysis
Fashion & Beauty: Highest live commerce intensity; rely on size/fit aids, try‑ons, and creator credibility. Electronics Accessories: Bundles, compatibility prompts, and warranty clarity reduce returns. Home & Kitchen: Demos and before/after framing; team goals for room‑makeovers. Specialty Foods: Sampling promos, freshness guarantees, and delivery slots. Fitness & Wellness: Routine challenges and accountability streaks. Across segments, anchor missions to product discovery and trial; align offers to margin; and track per‑segment KPIs (CVR, session minutes, refunds).
Geography Analysis
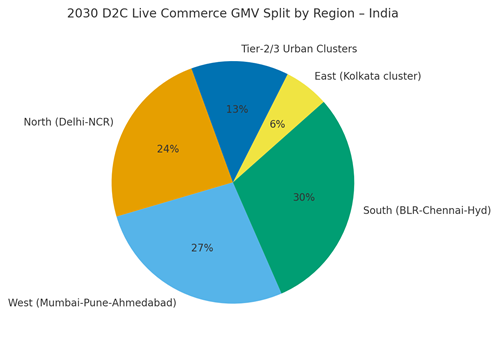
By 2030, South (~30%), West (~27%), and North (~24%) account for ~81% of India’s D2C live commerce GMV; East (~6%) and Tier‑2/3 urban clusters (~13%) grow as vernacular content and logistics scale. South benefits from creator ecosystems and tech infrastructure; West from commerce density and payments; North from media and influencer hubs. East and Tier‑2/3 expand with regional anchors, COD/UPI parity, and localized fulfillment. Localization principles: set event calendars by festival seasons; tailor prompts to bandwidth realities; and offer local payment preferences. The pie chart shows the modeled 2030 split across regions.
Execution: centralize event fabric and experimentation; let regions own creator rosters, promotions, and language variants. Monitor region‑specific KPIs and adapt cadence/offer density accordingly.
Competitive Landscape
Stacks converge around player SDKs, interactivity engines, real‑time analytics/decisioning, payments/anti‑fraud, and creator/affiliate tooling. Incumbents (marketplaces, social platforms) compete with brand‑owned studios and SaaS platforms that offer event fabrics and gamification. Differentiation vectors: (1) <300 ms interaction SLOs, (2) scene‑level experimentation and metadata, (3) payments + anti‑fraud reliability, (4) creator ops workflow depth, (5) attribution rigor into CRM/RMN. Procurement guidance: modular contracts, open APIs, latency/uptime SLAs, and holdout‑ready analytics. Competitive KPIs: CTR→cart, cart→purchase CVR, session minutes, repeat buyer share, refund rate, and incremental margin after incentives/returns. Winners will treat live commerce as a weekly performance discipline not a quarterly stunt.
Report Details
Proceed To Buy
Want a More Customized Experience?
- Request a Customized Transcript: Submit your own questions or specify changes. We’ll conduct a new call with the industry expert, covering both the original and your additional questions. You’ll receive an updated report for a small fee over the standard price.
- Request a Direct Call with the Expert: If you prefer a live conversation, we can facilitate a call between you and the expert. After the call, you’ll get the full recording, a verbatim transcript, and continued platform access to query the content and more.
68 Circular Road, #02-01 049422, Singapore
Revenue Tower, Scbd, Jakarta 12190, Indonesia
4th Floor, Pinnacle Business Park, Andheri East, Mumbai, 400093
Cinnabar Hills, Embassy Golf Links Business Park, Bengaluru, Karnataka 560071
Request Custom Transcript
Related Transcripts

$ 1395


68 Circular Road, #02-01 049422, Singapore
Revenue Tower, Scbd, No.52-53, Jakarta 12190, Indonesia
Cinnabar Hills, Embassy Golf Links Business Park, Bengaluru, Karnataka 560071
4th Floor, Pinnacle Business Park, Andheri East, Mumbai, 400093


68 Circular Road, #02-01 049422, Singapore
Revenue Tower, Scbd, Jakarta 12190, Indonesia
4th Floor, Pinnacle Business Park, Andheri East, Mumbai, 400093
Cinnabar Hills, Embassy Golf Links Business Park, Bengaluru, Karnataka 560071