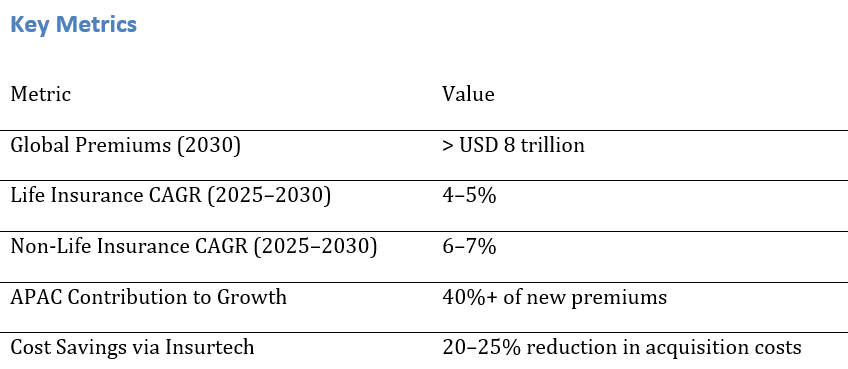
The global insurance market, spanning life and non-life segments, is poised for steady growth between 2025 and 2030. Rising middle-class populations, digital distribution, regulatory modernization, and product innovation are driving penetration. By 2030, global premiums are expected to surpass USD 8 trillion, with non-life insurance outpacing life in growth due to health, motor, and cyber coverage demand. This report analyzes growth trends, segment shifts, regulatory impact, and competitive positioning.
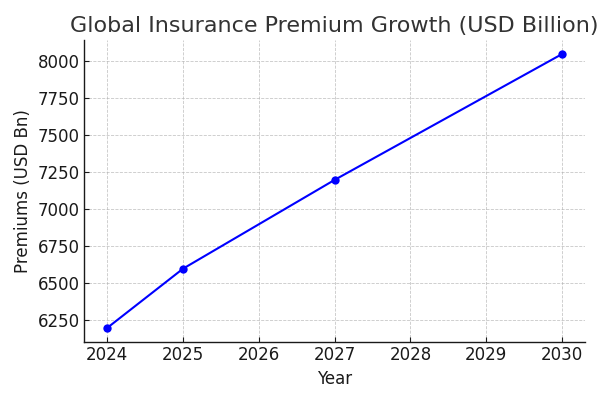
The insurance market is projected to exceed USD 8 trillion in premiums by 2030, up from USD 6.2 trillion in 2024. Life insurance will account for ~55% of premiums, while non-life expands faster to capture 45%. Growth is supported by expanding middle-class households, higher insurance penetration in emerging markets, and post-pandemic awareness of protection products. By geography, APAC will lead premium growth, contributing over USD 800 billion in new premiums.
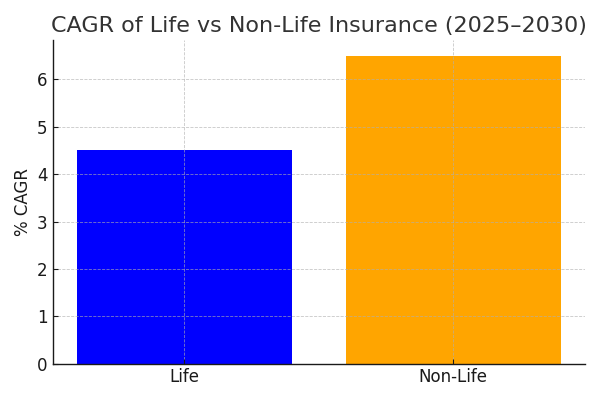
Life insurance is expected to grow at a CAGR of 4–5% during 2025–2030, supported by savings-linked products and retirement plans. Non-life will outpace at 6–7% CAGR, driven by health, motor, and cyber insurance. Non-life premiums are forecast to rise from USD 2.6 trillion in 2024 to over USD 3.7 trillion in 2030. Life premiums will grow more moderately, reaching ~USD 4.4 trillion by 2030.
Health insurance premiums are expected to grow ~8% CAGR, motor at ~5%, and cyber insurance at over 15%. Property insurance is stabilizing, with climate risks pushing up pricing. Cyber will be the fastest-growing line, from USD 15 billion in 2024 to USD 35–40 billion by 2030. Health remains the anchor of non-life, projected to account for one-third of global non-life premiums by 2030.
APAC will drive >40% of incremental premium growth by 2030, fueled by China, India, and Southeast Asia. Europe will see steady but slower growth (3–4% CAGR), while the US market will expand at 4–5%, led by property & casualty. In Latin America and Africa, penetration remains low but digital-first models are unlocking demand. Regional shifts indicate insurers must localize products and adapt to regulatory frameworks to capture growth.
Insurtech adoption is reducing acquisition costs by 20–25% through digital onboarding, AI-driven underwriting, and API-based distribution partnerships. Digital channels are expanding penetration in underserved markets, with APAC leading in adoption. Global insurtech funding is rebounding, expected to exceed USD 15 billion annually by 2027. By 2030, over 25% of new policy sales in non-life insurance will flow through digital-only platforms.
Millennials and Gen Z are driving demand for digital-first insurance solutions, preferring non-life coverage like health, property, and cyber over traditional life insurance. Aging populations in developed markets sustain demand for annuities and retirement products. By 2030, consumers under 40 will account for ~45% of global premium growth. Lifestyle risks, urbanization, and increased health expenditures will reinforce demand for non-life products.
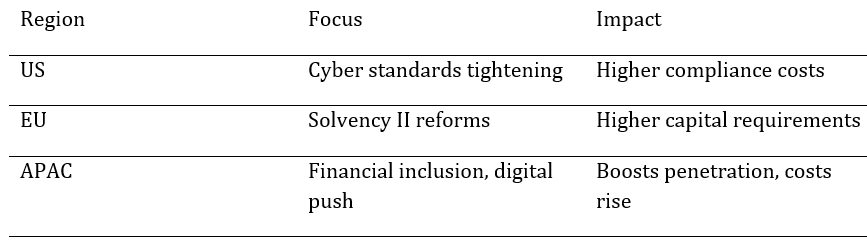
Regulatory changes will shape market economics. The EU is implementing Solvency II reforms, increasing capital requirements. The US is tightening cyber insurance standards, while APAC regulators are promoting financial inclusion and digital policies. Compliance costs are expected to rise 10–15% by 2030, especially in non-life lines with high-risk exposures. Harmonization remains a challenge, as fragmented regulations increase operational costs for global insurers.
Combined ratios in non-life are tightening, expected to improve from ~99% in 2024 to ~96% by 2030, driven by better pricing and automation. Life insurers face margin pressures from low interest rates but benefit from investment-linked product growth. Solvency margins are forecast to remain above 120% in developed markets, though APAC players will face capital adequacy challenges. Profitability will hinge on efficiency and digital adoption.
The market is consolidating, with top 20 global insurers holding ~65% of premiums. However, insurtech challengers are eroding share in niches like digital health and cyber. US and EU incumbents are investing heavily in partnerships or acquisitions of insurtechs. APAC markets see joint ventures between insurers and tech platforms. By 2030, hybrid models combining traditional balance sheet strength with tech-driven distribution will dominate.
Key risks include climate-related catastrophes, cyber-attacks, and macroeconomic shocks. Non-life insurers face rising claims costs, with climate losses alone projected to exceed USD 200 billion annually by 2030. Life insurers risk slower growth in mature markets and face reputational risks around data privacy. Regulatory fragmentation and capital adequacy remain challenges. Insurers that fail to digitize will face cost disadvantages of 20–30% compared to tech-enabled peers.
AI-powered M&A platforms are forecast to grow at a CAGR of 18–20% between 2025 and 2035. By 2030, 40% of mid-to-large M&A transactions in the US and EU are expected to leverage AI platforms, up from under 10% in 2025. Adoption will be fastest among investment banks and PE firms, driven by high deal volumes. By 2035, adoption could surpass 70%, particularly as corporates integrate AI into mid-market transactions.
Predictive analytics reduces the time to identify acquisition targets by 25–35%, compared to traditional scouting. Platforms analyze structured financials, unstructured data (news, patents, filings), and alternative data (web traffic, supply chain). In US case studies, target identification pipelines dropped from 8 weeks to 5. EU firms emphasize compliance-first predictive algorithms, slowing speed but improving auditability. The quantifiable advantage is faster screening of hundreds of targets, improving probability-adjusted deal quality.
Due diligence automation using AI reduces timelines by 30–40%. For example, diligence cycles that traditionally take 12 weeks can be compressed to 7–8 weeks. Cost savings are also material, with firms reporting 15–25% lower diligence costs by reducing human labor in document review and compliance checks. In high-volume PE deals, this means millions in annual savings. EU regulators mandate explainable AI in diligence automation, adding compliance layers.
AI-powered synergy modeling improves valuation accuracy by 15–20%. Machine learning simulations test post-merger revenue and cost synergies, reducing overestimation risks. In case studies, AI integration forecasts helped reduce integration failure rates from 35% to under 25%. US firms adopt synergy modeling for scenario planning, while EU players focus on operational synergies across borders. By 2035, AI-based synergy models are expected to be standard practice in >60% of large deals.
AI platforms rely on structured data (financials, filings), semi-structured (supply chain, customer databases), and unstructured (news, patents, web). Alternative datasets ESG metrics, employee sentiment are increasingly used. The challenge lies in harmonizing fragmented datasets, ensuring GDPR compliance in the EU, and mitigating noise in alternative data. Poor data quality can reduce accuracy by 20–25%. Firms investing in robust ETL processes achieve higher predictive reliability.
The EU’s AI Act classifies M&A AI applications as 'high-risk,' mandating transparency, bias testing, and explainability. Compliance costs are projected to add 8–12% to platform operating costs by 2030. The US lacks a centralized AI law but relies on sectoral oversight by SEC and FTC. This creates a regulatory gap: faster adoption in the US but higher compliance credibility in the EU. Firms operating cross-border must align with the stricter EU standards.
AI models risk embedding bias from historical deal data, potentially excluding innovative targets or overvaluing conventional ones. Over-reliance on AI outputs without human oversight could misprice synergies or miss compliance red flags. Compliance exposure is heightened in EU deals where explainability is mandatory. Quantitatively, firms estimate that reliance on unverified AI models could increase regulatory breach risk by 15–20%. Leading vendors now emphasize 'human-in-the-loop' oversight to mitigate risks.
The AI M&A platform market is fragmented but consolidating. US-based startups focus on predictive analytics speed, while EU vendors prioritize compliance-first platforms. Large SaaS providers (Salesforce, Microsoft, Refinitiv) are embedding M&A analytics modules. Investment banks are developing proprietary platforms, and PE firms are co-investing in vendors. Market share is expected to consolidate to the top 5 vendors holding ~60% by 2030.
Investment banks use AI for sector scanning, target scouting, and predictive deal origination. PE firms emphasize due diligence automation and portfolio synergy modeling. In PE case studies, diligence timelines were reduced from 12 weeks to 7, cutting costs by 20%. Banks gained deal origination efficiency, screening ~30% more targets annually. By 2030, 50% of PE firms in the US/EU are expected to deploy AI platforms, compared to 35% of investment banks.
By 2035, AI adoption in US/EU M&A is expected to exceed 70%, but human oversight will remain central. AI will dominate target identification, diligence review, and synergy modeling, while humans lead negotiations, cultural assessments, and regulatory navigation. Quantitatively, firms using AI-human collaboration models report 25% higher success rates in achieving projected synergies versus AI-only or human-only approaches. The long-term outlook is collaborative, not substitutive.
• By 2030, 40% of mid-to-large US/EU M&A deals will use AI platforms.
• Predictive targeting improves identification accuracy by 25–35%.
• Due diligence automation cuts timelines by 30–40%.
• Synergy modeling enhances valuation accuracy by 15–20%.
• EU’s AI Act mandates transparency and bias testing; US oversight remains sectoral.
• Market CAGR (2025–2035) projected at 18–20%.
Neobanks are reshaping retail and SME banking in the U.S. and Europe, offering low-cost, mobile-first financial services that bypass legacy branch networks. By 2025, the combined neobank market is projected to reach 230 million active users globally, with the U.S. and Europe accounting for ~45% of total adoption. By 2030, user penetration in these regions is expected to grow to 350 million users, driving market revenues from $85 billion (2025) to $160 billion (2030), at a CAGR of 13.2%.
Revenue streams are diversifying beyond interchange fees, with lending products, SME services, wealth management add-ons, and subscription tiers contributing up to 40–45% of total income by 2030. Cost efficiency is a key differentiator: average customer acquisition cost (CAC) for neobanks is 30–35% lower than traditional banks, while digital-first servicing cuts per-user operating costs by 40–50%. Regulatory clarity under PSD3 in Europe and U.S. digital banking charters will further accelerate adoption, although customer churn and trust deficits remain challenges compared to incumbents.
Neobanking is no longer an experiment it is a scalable, revenue-generating banking model, transforming consumer finance and small business banking across U.S. and European markets.
5 Key Quantitative Takeaways (2025–2030, U.S. & EU):
Download the full report to explore adoption benchmarks, revenue models, and competitive strategies shaping neobanking in the U.S. and Europe.
The U.K. motor insurance market is entering a new growth phase, shaped by regulatory reforms, telematics adoption, and digital claims management. By 2025, the market is projected to reach £18.5 billion in gross written premiums (GWP), expanding to £22.7 billion by 2030, reflecting a CAGR of 4.1%. Rising vehicle ownership, EV penetration, and the recovery of post-pandemic travel demand are key drivers of premium expansion.
Claims dynamics are shifting, with average repair costs rising 6–8% annually due to advanced driver assistance systems (ADAS) and EV parts, while digital-first claims processing is reducing settlement times by 25–30%. Telematics-based policies are expected to represent 20–25% of new policies by 2030, improving risk assessment and lowering premiums for safe drivers. Insurtech players are capturing market share through AI-driven underwriting and usage-based insurance models, while traditional insurers adapt with hybrid offerings.
The U.K. motor insurance market is no longer defined by legacy underwriting it is evolving into a tech-driven, consumer-focused sector, balancing premium growth with innovation in claims and policy management.
5 Key Quantitative Takeaways (2025–2030, U.K.):
Download the full report to explore premium growth drivers, claims management innovation, and competitive strategies in the U.K. motor insurance market.
The private credit market is emerging as one of the fastest-growing segments in alternative investments, driven by bank lending pullbacks, institutional demand, and direct lending strategies. By 2025, global private credit assets under management (AUM) are projected to reach $1.6 trillion, growing to $2.4 trillion by 2030, at a CAGR of 8.5%. The U.S. will continue to dominate with ~60% market share, while Europe expands to ~25%, supported by regulatory changes favoring non-bank lending.
Direct lending remains the largest sub-strategy, expected to represent 45–50% of total private credit AUM by 2030, while distressed debt and opportunistic credit strategies expand amid rising interest rates and refinancing risks. Institutional investors, including pension funds and insurance companies, are increasing allocations, with surveys showing 30–35% of LPs plan to raise private credit exposure by 2027. Yield premiums over public credit average 300–400 bps, making the asset class highly attractive in a high-rate environment.
Private credit is no longer a niche alternative it is becoming a mainstream financing channel, offering investors yield stability and borrowers flexible capital, reshaping debt markets in the U.S. and EU.
5 Key Quantitative Takeaways (2025–2030, US & EU):
Download the full report to explore private credit AUM growth, sub-strategy trends, and institutional adoption across U.S. and European markets.
The hedge fund industry in the U.S. and Europe is projected to expand steadily, supported by institutional inflows, alternative investment demand, and technology-driven strategies. By 2025, global hedge fund assets under management (AUM) are expected to reach $5.3 trillion, growing to $6.5 trillion by 2030, representing a CAGR of 4.2%. The U.S. will remain dominant, accounting for ~70% of global AUM, while European hedge funds grow their share to ~20%, fueled by sovereign wealth funds and pension allocations.
Strategy shifts are evident: quantitative and AI-driven funds are projected to grow assets by 8–10% annually, while ESG-focused hedge funds are on track to represent 15% of European AUM by 2030. Fee compression is driving managers to adopt performance-linked models, with average management fees declining from 1.4% in 2025 to 1.1% by 2030, while performance fees hover near 17–18%. Hedge funds integrating digital assets and private credit strategies are reporting 20–25% higher inflows compared to traditional equity long/short strategies.
The hedge fund sector is no longer operating in silo it is a diversified, tech-enabled industry, adapting to investor demands, regulatory pressures, and global market volatility to capture sustainable growth in the U.S. and EU.
5 Key Quantitative Takeaways (2025–2030, US & EU):
• AUM growth: $5.3T → $6.5T (CAGR 4.2%)
• U.S. share of global AUM: ~70%
• European share of global AUM: ~20%
• Decline in average management fees: 1.4% → 1.1%
• ESG-focused hedge funds: 15% of EU AUM by 2030
Download the full report to explore hedge fund AUM growth, strategy shifts, fee models, and regional investment trends across U.S. and European markets.