

68 Circular Road, #02-01 049422, Singapore
Revenue Tower, Scbd, Jakarta 12190, Indonesia
4th Floor, Pinnacle Business Park, Andheri East, Mumbai, 400093
Cinnabar Hills, Embassy Golf Links Business Park, Bengaluru, Karnataka 560071


Connect With Us


68 Circular Road, #02-01 049422, Singapore
Revenue Tower, Scbd, Jakarta 12190, Indonesia
4th Floor, Pinnacle Business Park, Andheri East, Mumbai, 400093
Cinnabar Hills, Embassy Golf Links Business Park, Bengaluru, Karnataka 560071
Connect With Us
68 Circular Road, #02-01 049422, Singapore
Revenue Tower, Scbd, Jakarta 12190, Indonesia
4th Floor, Pinnacle Business Park, Andheri East, Mumbai, 400093
Cinnabar Hills, Embassy Golf Links Business Park, Bengaluru, Karnataka 560071
Request Custom Transcript
U.K. Motor Insurance Market: Premium Growth, Claims Trends & Digital Adoption Forecast (2025–2030)
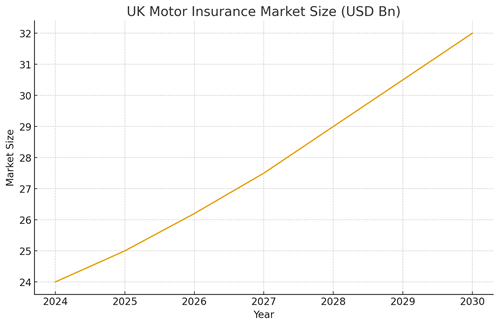
The U.K. motor insurance market is entering 2025 with elevated cost pressures but clearer digital tailwinds. After significant pricing volatility through 2023–24 when average premiums spiked and then eased carriers still face historically high repair and bodily injury costs, supply‑chain delays, and EV‑related repair complexity. Against this backdrop, premium volume is set to grow at a modest 4–5.5% CAGR over 2025–2030, taking the market from roughly USD 24 billion in 2024 to USD 32–35 billion by 2030. The growth mix is expected to be led by renewal pricing, incremental new‑business in digital channels, usage‑based insurance (UBI) expansion, and a gradual rise in commercial motor demand as fleets electrify. Profitability remains the central challenge. Combined ratios improved in 2024 after a difficult 2023, but continuing claims inflation especially in parts, labour and hire‑car costs keeps risk on the upside. EV severity remains structurally higher due to battery diagnostics, ADAS calibration and repair network constraints. At the same time, price‑sensitive customers and tighter ‘fair value’ expectations constrain the ability to pass through costs. Winning strategies emphasise: (1) advanced claims analytics and supplier‑network optimisation to control severity; (2) telematics‑driven pricing and proactive driver engagement to reduce frequency; (3) digital self‑service and straight‑through processing to compress expense ratios; and (4) portfolio re‑mix toward segments with better economics (fleets, UBI, embedded/partner channels).

What's Covered?
Report Summary
Key Takeaways
1. Modest but resilient premium growth (~4–5.5% CAGR, 2025–2030).
2. Claims severity remains the profitability swing factor; repair network control is decisive.
3. Digital distribution and self‑service drive expense‑ratio compression and growth.
4. UBI/telematics unlock risk segmentation and retention; expands addressable market.
5. Regulatory ‘fair value’ expectations limit blunt price pass‑through; efficiency matters.
6. Commercial fleets and EV‑tailored products are the fastest‑growing pockets.
7. Data/AI in claims (triage, fraud, salvage) are now table stakes for combined‑ratio wins.
8. Scale and cost discipline will shape consolidation; challengers pressure legacy cost bases.
Key Metrics

Market Size & Share (2019–2030)
We size the U.K. motor insurance market at ~USD 24 billion in 2024, reflecting a mature but shifting sector. Pandemic‑era mileage reductions and pricing interventions created a trough in 2020–21, followed by a sharp rebound as inflation and claims costs accelerated in 2022–24. Our forecast projects a measured ascent to USD 32–35 billion by 2030, implying ~4–5.5% CAGR. The growth path is not linear: 2025–26 absorb cost pressures and re‑rating; 2027–30 benefit from stabilising parts/labour inflation and digital productivity gains (straight‑through quote/bind/issue, digital FNOL, automated subrogation). Comprehensive policies retain the majority share of premiums, albeit with a slow tilt toward TPFT among the most price‑sensitive cohorts. Commercial motor remains a smaller base but expands faster as logistics, last‑mile and corporate fleets electrify. Market share distribution remains concentrated among the top carriers, though challenger/direct brands and embedded distribution at point‑of‑sale (dealers, mobility platforms) capture incremental growth. For portfolio planners, the implication is to defend core personal motor while over‑indexing investments toward direct digital and fleet solutions.
Market Analysis (Economics & Operating Levers)
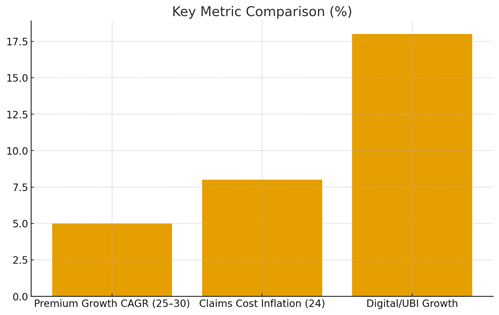
Operating economics reflect three opposing vectors: (1) premium growth that broadly tracks inflation and re‑rating; (2) elevated claims inflation (parts, labour, hire‑car duration) that pressures severity; and (3) rapid digital adoption that compresses expenses and improves conversion. The bar chart compares indicative rates: premium CAGR of ~5%, claims inflation still high‑single to low‑double digits in 2024, and digital/UBI adoption growing in the mid‑to‑high teens. The gap between claims inflation and achievable premium lift underscores why combined ratios remain volatile. Mitigation levers include: tighter repair‑network management (preferred suppliers, faster authorisations), analytics‑led triage (total‑loss vs repair), and fraud analytics. Telematics programmes strengthen risk selection and enable behavioural nudges that reduce accident frequency. On distribution, direct digital acquisition reduces commission drag versus aggregator‑led flows and increases lifetime value through better retention design (app‑based servicing, instalments, micro‑rewards). On product, EV‑specific covers (battery, software updates, courtesy EV) and usage‑based ‘pay‑how‑you‑drive’ options expand the addressable market while aligning price to risk. We expect leaders to blend these levers into a repeatable ‘cost‑to‑serve minus’ model, pushing combined ratios back below 100% on a through‑cycle basis.
Trends & Insights
• Electrification and ADAS: Rising EV penetration and sensor‑laden vehicles elevate repair complexity and cycle times; specialist networks and calibrated pricing are essential.
• Usage‑Based Insurance (UBI): Telematics adoption is scaling across young drivers and fleets; it improves segmentation, reduces frequency and supports retention through coaching.
• Digital First Journeys: Quote‑to‑bind in minutes, in‑app endorsements, and instant IDV changes are becoming standard; human support focuses on exceptions and complex claims.
• Claims Automation: AI triage, image‑based damage estimation, intelligent parts sourcing and automated salvage materially reduce loss‑adjustment expense.
• Fair‑Value & Conduct: Pricing transparency and renewal fairness rules cap simple rate‑through; carriers must earn margin via efficiency and product value.
• Embedded & Partner Sales: OEMs, dealers, leasing platforms and gig‑fleet aggregators emerge as scaled channels, improving unit economics via lower CAC.
• Consolidation & Capital: Scale advantages in data, procurement and IT change narrow the field; selective M&A and reinsurance optimisation de‑risk earnings.
• Data Advantage: First‑party telematics and claims data sets will define moat depth; analytics talent and model governance become strategic assets.
Segment Analysis
Coverage: Comprehensive policies account for ~85–88% of personal motor premiums; TPFT grows quicker in price‑sensitive segments and older vehicles. Vehicle/Powertrain: Passenger cars dominate, with EV/hybrids a fast‑growing sub‑segment exhibiting higher average severity; commercial vehicles (LCVs, last‑mile) expand fastest. End‑User: Individuals remain the bulk of the pool, but SME/enterprise fleets see increasing telematics penetration and value‑added risk services (driver coaching, route analytics). Channel: Aggregators hold roughly half of personal motor flows; direct digital grows faster, supported by improved UX and loyalty mechanics. Economically, the most attractive cells combine lower acquisition cost, better data for risk selection, and controllable repair outcomes. Priority opportunity cells include: EV telematics for urban drivers; pay‑per‑mile products for low‑mileage cohorts; and fleet programmes bundling insurance with telematics hardware/software and repair service‑level agreements. Portfolio actions: calibrate pricing corridors by powertrain and ADAS features; expand preferred repairer panels that can handle EV/ADAS; and push embedded offerings with dealer/leasing partners to lower CAC while improving retention.
Geography Analysis
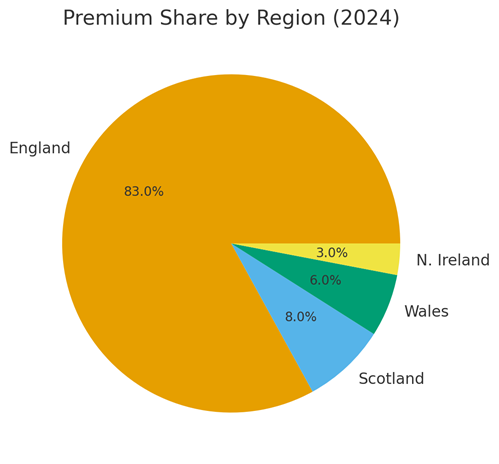
England represents the vast majority of U.K. motor premiums, followed by Scotland, Wales and Northern Ireland. Urban centres especially London and larger metros exhibit higher average premiums due to traffic density, theft risk, repair costs and hire‑car durations. Conversely, rural regions display lower frequency but may see longer repair cycle times due to network reach. EV adoption, public‑charging infrastructure and telematics penetration are uneven across regions, producing distinct risk/price patterns. Through 2030, we expect the highest growth where EV adoption and digital direct channels are densest (urban corridors), while price‑sensitive regions tilt to TPFT and usage‑based products. Regional strategy should therefore differentiate propositions urban: EV‑ready repair networks, app‑centric servicing and UBI; rural: value‑led cover with strong roadside/repair logistics. Carrier distribution footprints should mirror these realities, with targeted partnerships (dealers, mobility platforms) in high‑EV regions and aggregator presence sustained elsewhere.
Competitive Landscape
The market remains moderately concentrated, with the top carriers commanding the majority of premiums. Competitive dynamics are shaped by aggregator price competition, direct‑first challengers, and insurtechs focused on UBI, gig‑fleet and embedded models. We see four archetypes winning share: (1) scale incumbents with disciplined cost bases and leading repair networks; (2) direct‑digital brands with low CAC and superior UX; (3) specialist EV/ADAS carriers; and (4) fleet platforms bundling telematics, analytics and insurance. Strategic levers include: selective M&A for scale and tech capabilities; first‑party data accumulation (telematics, claims); automation across FNOL to settlement; and pricing sophistication that recognises EV/ADAS repair realities. Execution against these levers, coupled with reinsurance optimisation, is the path to sub‑100% combined ratios on a through‑cycle view
Report Details
Proceed To Buy
Want a More Customized Experience?
- Request a Customized Transcript: Submit your own questions or specify changes. We’ll conduct a new call with the industry expert, covering both the original and your additional questions. You’ll receive an updated report for a small fee over the standard price.
- Request a Direct Call with the Expert: If you prefer a live conversation, we can facilitate a call between you and the expert. After the call, you’ll get the full recording, a verbatim transcript, and continued platform access to query the content and more.
68 Circular Road, #02-01 049422, Singapore
Revenue Tower, Scbd, Jakarta 12190, Indonesia
4th Floor, Pinnacle Business Park, Andheri East, Mumbai, 400093
Cinnabar Hills, Embassy Golf Links Business Park, Bengaluru, Karnataka 560071
Request Custom Transcript
Related Transcripts
$ 1450


$ 1450

68 Circular Road, #02-01 049422, Singapore
Revenue Tower, Scbd, No.52-53, Jakarta 12190, Indonesia
Cinnabar Hills, Embassy Golf Links Business Park, Bengaluru, Karnataka 560071
4th Floor, Pinnacle Business Park, Andheri East, Mumbai, 400093


68 Circular Road, #02-01 049422, Singapore
Revenue Tower, Scbd, Jakarta 12190, Indonesia
4th Floor, Pinnacle Business Park, Andheri East, Mumbai, 400093
Cinnabar Hills, Embassy Golf Links Business Park, Bengaluru, Karnataka 560071