

68 Circular Road, #02-01 049422, Singapore
Revenue Tower, Scbd, Jakarta 12190, Indonesia
4th Floor, Pinnacle Business Park, Andheri East, Mumbai, 400093
Cinnabar Hills, Embassy Golf Links Business Park, Bengaluru, Karnataka 560071


Connect With Us


68 Circular Road, #02-01 049422, Singapore
Revenue Tower, Scbd, Jakarta 12190, Indonesia
4th Floor, Pinnacle Business Park, Andheri East, Mumbai, 400093
Cinnabar Hills, Embassy Golf Links Business Park, Bengaluru, Karnataka 560071
Connect With Us
68 Circular Road, #02-01 049422, Singapore
Revenue Tower, Scbd, Jakarta 12190, Indonesia
4th Floor, Pinnacle Business Park, Andheri East, Mumbai, 400093
Cinnabar Hills, Embassy Golf Links Business Park, Bengaluru, Karnataka 560071
Request Custom Transcript
Decentralized Finance (DeFi) Market to Skyrocket: USD 20.5 Billion (2025) to USD 231.2 Billion by 2030, Growing at a 53.7% CAGR
The global Decentralized Finance (DeFi) market is projected to surge from USD 20.5 billion in 2025 to USD 231.2 billion by 2030, expanding at a CAGR of 53.7%. The explosive growth is driven by the widespread adoption of blockchain-based lending, staking, and trading protocols, alongside Web3 wallet integration and tokenized asset ecosystems. DeFi’s momentum reflects a paradigm shift from centralized financial systems to autonomous, programmable financial infrastructure, offering transparency, accessibility, and yield optimization. Supported by Ethereum Layer-2 scaling, DeFi 2.0 liquidity models, and the rise of institutional DeFi, the sector is set to redefine global financial inclusion and capital efficiency by 2030.

What's Covered?
Report Summary
Key Takeaways
- Market size to jump from USD 20.5B (2025) to USD 231.2B (2030) at 53.7% CAGR.
- Ethereum and Layer-2 chains (Arbitrum, Optimism, Polygon) to host 70% of DeFi TVL.
- DeFi lending and staking protocols to command 48% of total market share.
- Institutional DeFi participation projected to exceed USD 80B by 2030.
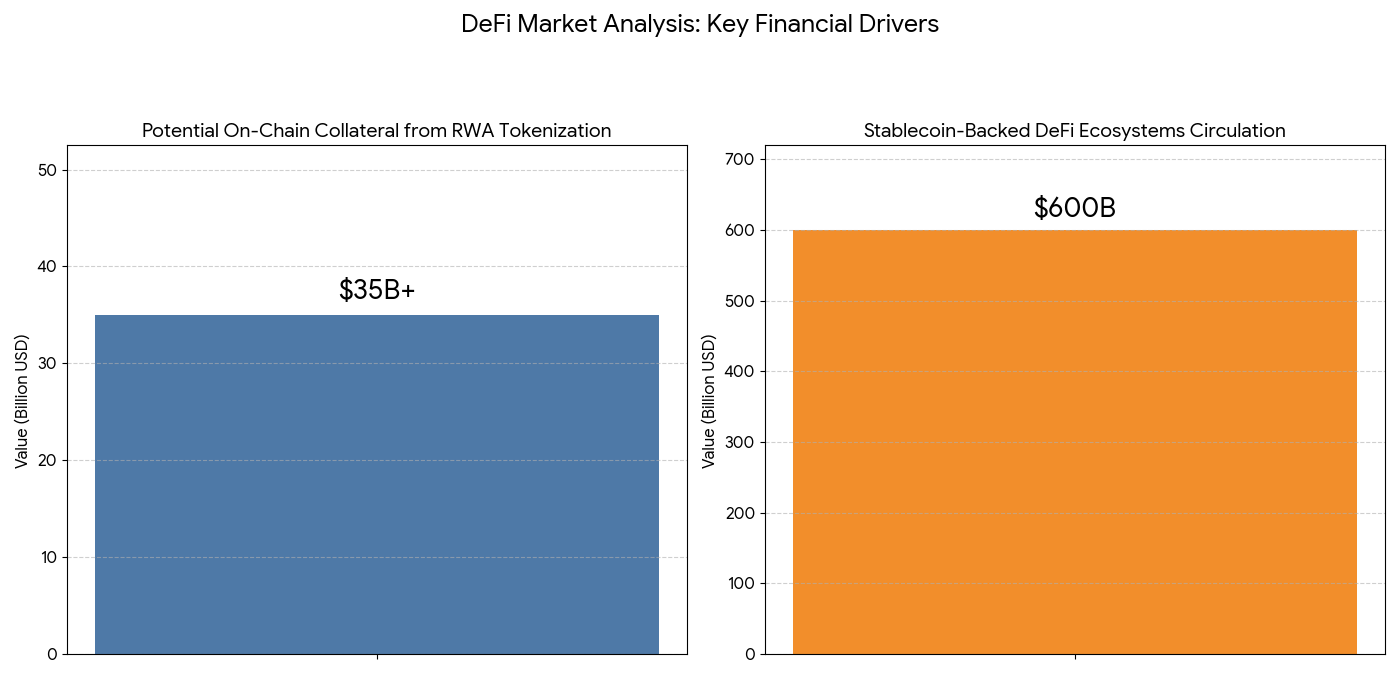
- Tokenized RWAs (Real-World Assets) expected to reach USD 35B market cap by 2030.
- Cross-chain interoperability improving capital mobility by 3.5×.
- Stablecoin circulation to surpass USD 600B globally.
- AI-based DeFi analytics tools enhancing yield optimization and fraud detection.
- DeFi insurance protocols forecast to exceed USD 10B in coverage.
- Regulatory compliance layers (DeFi KYC/AML modules) emerging across the U.S. and EU.
Key Metrics
Market Size & Share
The DeFi market will expand from USD 20.5B in 2025 to USD 231.2B by 2030, driven by global adoption of smart contract-based financial platforms. Lending and staking protocols represent nearly half of all DeFi activity, supported by innovations like liquid staking and flash loan infrastructure. Ethereum remains the dominant ecosystem, hosting over 60% of total value locked (TVL), while Layer-2 solutions like Arbitrum, Polygon, and Optimism account for another 10% due to lower fees and higher throughput. The U.S., EU, and Asia-Pacific are leading adoption, with institutional DeFi participation projected to exceed USD 80B by 2030.
Market Analysis
DeFi’s explosive trajectory is a direct result of blockchain maturity and rising trust in smart contract-driven finance. From decentralized exchanges (DEXs) to synthetic asset platforms, DeFi protocols are displacing traditional intermediaries. Institutional-grade liquidity pools, combined with AI-based portfolio management, are reshaping yield generation models. The tokenization of RWAs, including bonds, commodities, and carbon credits, will unlock USD 35B+ in on-chain collateral value. Cross-chain bridges and interoperability standards (Cosmos IBC, Polkadot XCMP) are enabling seamless asset transfer across networks. With stablecoin-backed DeFi ecosystems achieving USD 600B circulation, the industry is entering a phase of sustainable scalability and mainstream financial convergence.
Trends & Insights
- DeFi 2.0 Evolution: Enhanced liquidity retention through protocol-owned liquidity models.
- AI & Predictive Analytics: Real-time yield routing and risk scoring automation.
- Tokenized Assets Surge: Institutional focus on tokenizing private credit and real estate.
- Cross-Chain Integration: Multi-network ecosystems improving capital velocity.
- Regulated DeFi: U.S. and EU frameworks introducing KYC-linked DeFi layers.
- DAO Governance: Decentralized decision-making ensuring community-led development.
- Modular Blockchains: Adoption of app-specific chains like Celestia improving scalability.
- DeFi Insurance Growth: Protocol coverage exceeding USD 10B, reducing liquidity risk.
- Data Oracles: Chainlink and Pyth Network powering secure off-chain data integration.
- Sustainability Initiatives: Energy-efficient blockchains (e.g., Solana, Polygon) enhancing ESG alignment for DeFi projects.
Segment Analysis
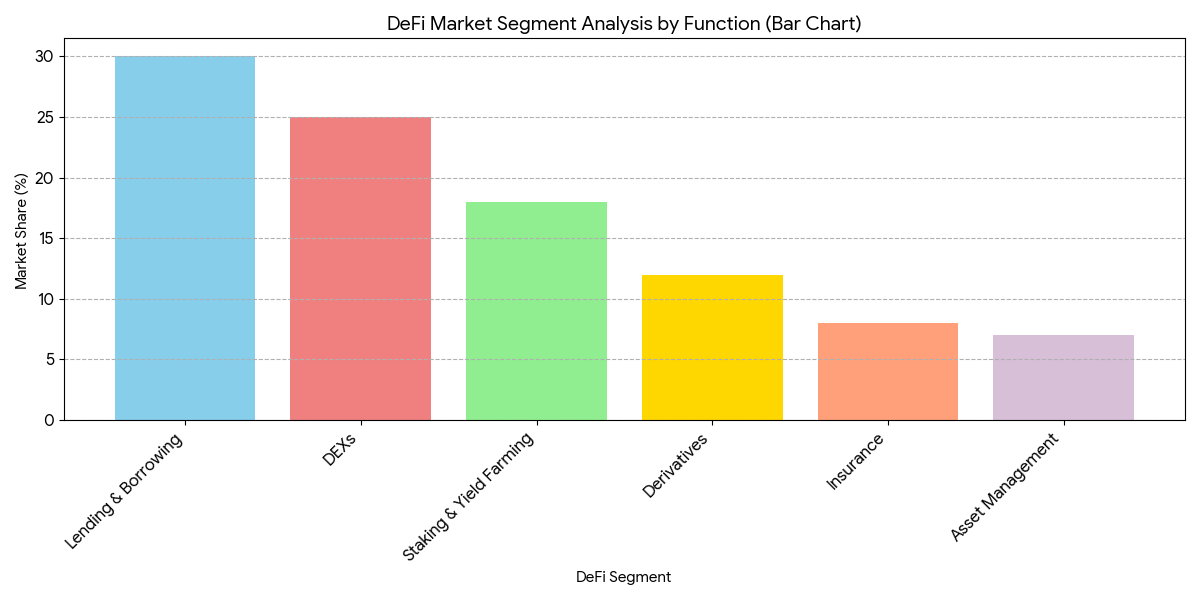
By function, the market divides into lending & borrowing (30%), DEXs (25%), staking & yield farming (18%), derivatives (12%), insurance (8%), and asset management (7%). The lending segment, led by protocols like Aave, Compound, and MakerDAO, dominates due to high liquidity and consistent returns. DEXs, spearheaded by Uniswap and Curve, are expanding through cross-chain swaps and aggregator models. Yield farming and staking are evolving into liquid staking derivatives (LSDs), offering liquidity while maintaining rewards. Insurance protocols, such as Nexus Mutual, are mitigating smart contract risks, while DeFi asset managers like Yearn and Balancer are creating structured, automated portfolio strategies.
Geography Analysis
The U.S. and Europe collectively represent 55% of total DeFi TVL, driven by institutional liquidity participation and regulatory sandbox initiatives. Asia-Pacific, particularly Singapore, Hong Kong, and South Korea, contributes 30%, propelled by strong fintech integration and retail investor adoption. The Middle East, led by UAE and Bahrain, is emerging as a DeFi regulatory hub, experimenting with compliant DeFi sandboxes. Africa and Latin America, though nascent, are witnessing grassroots adoption of stablecoin-based DeFi lending, providing alternative financial access for the unbanked. Globally, the cross-chain market integration trend will expand geographic participation and liquidity uniformity by 2030.
Competitive Landscape
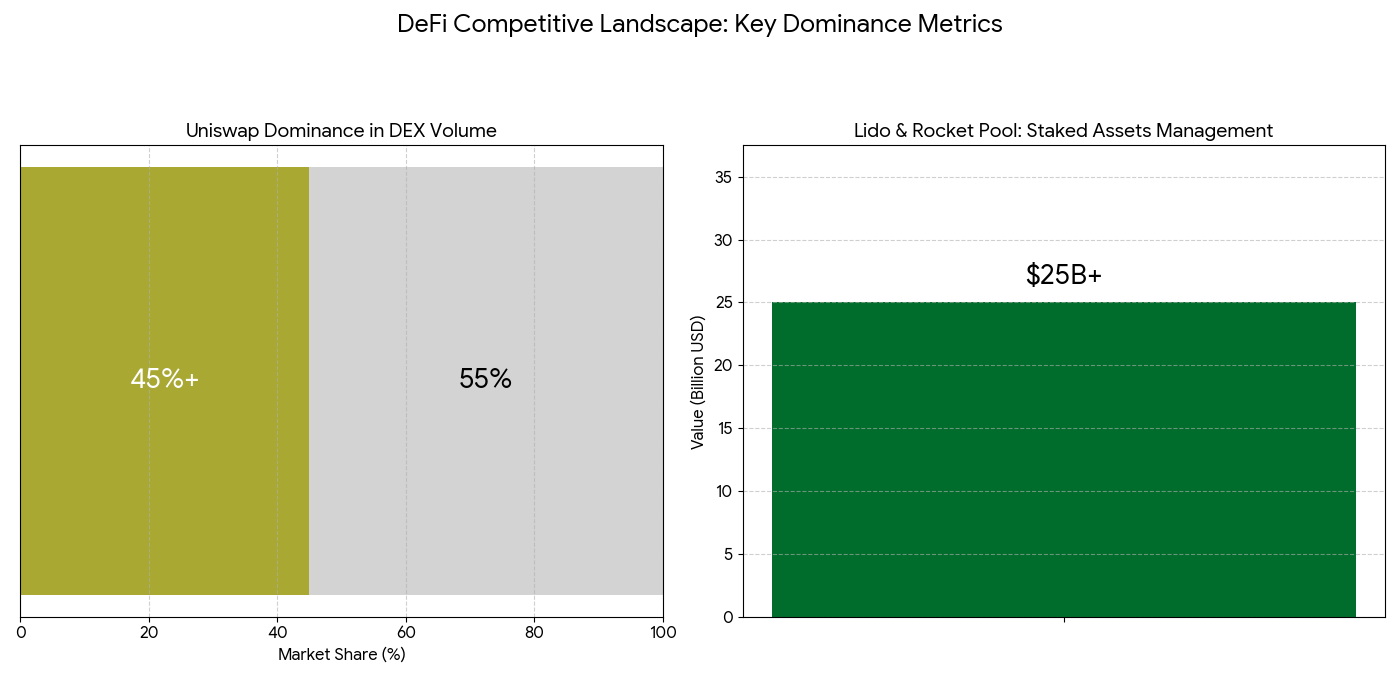
Key market participants include Uniswap, Aave, MakerDAO, Compound, Curve Finance, Lido, Yearn Finance, PancakeSwap, and Synthetix, alongside infrastructure providers like Chainlink, Polygon, and Arbitrum. Uniswap continues to lead in DEX volume (>45%), while Aave and Compound dominate lending pools. Lido Finance and Rocket Pool spearhead the liquid staking derivatives (LSD) segment, collectively managing over USD 25B in staked assets. Curve and Balancer lead multi-asset liquidity pools, optimizing yield efficiency. The institutional DeFi segment, led by Aave Arc and Centrifuge, is bridging regulated capital with decentralized ecosystems. Strategic alliances between protocols and traditional financial institutions signal the convergence of CeFi and DeFi, creating a multi-trillion-dollar programmable finance ecosystem by the next decade.
Report Details
Proceed To Buy
Want a More Customized Experience?
- Request a Customized Transcript: Submit your own questions or specify changes. We’ll conduct a new call with the industry expert, covering both the original and your additional questions. You’ll receive an updated report for a small fee over the standard price.
- Request a Direct Call with the Expert: If you prefer a live conversation, we can facilitate a call between you and the expert. After the call, you’ll get the full recording, a verbatim transcript, and continued platform access to query the content and more.
68 Circular Road, #02-01 049422, Singapore
Revenue Tower, Scbd, Jakarta 12190, Indonesia
4th Floor, Pinnacle Business Park, Andheri East, Mumbai, 400093
Cinnabar Hills, Embassy Golf Links Business Park, Bengaluru, Karnataka 560071
Request Custom Transcript
Related Transcripts
$ 1450


$ 1450

68 Circular Road, #02-01 049422, Singapore
Revenue Tower, Scbd, No.52-53, Jakarta 12190, Indonesia
Cinnabar Hills, Embassy Golf Links Business Park, Bengaluru, Karnataka 560071
4th Floor, Pinnacle Business Park, Andheri East, Mumbai, 400093


68 Circular Road, #02-01 049422, Singapore
Revenue Tower, Scbd, Jakarta 12190, Indonesia
4th Floor, Pinnacle Business Park, Andheri East, Mumbai, 400093
Cinnabar Hills, Embassy Golf Links Business Park, Bengaluru, Karnataka 560071