

68 Circular Road, #02-01 049422, Singapore
Revenue Tower, Scbd, Jakarta 12190, Indonesia
4th Floor, Pinnacle Business Park, Andheri East, Mumbai, 400093
Cinnabar Hills, Embassy Golf Links Business Park, Bengaluru, Karnataka 560071


Connect With Us


68 Circular Road, #02-01 049422, Singapore
Revenue Tower, Scbd, Jakarta 12190, Indonesia
4th Floor, Pinnacle Business Park, Andheri East, Mumbai, 400093
Cinnabar Hills, Embassy Golf Links Business Park, Bengaluru, Karnataka 560071
Connect With Us
68 Circular Road, #02-01 049422, Singapore
Revenue Tower, Scbd, Jakarta 12190, Indonesia
4th Floor, Pinnacle Business Park, Andheri East, Mumbai, 400093
Cinnabar Hills, Embassy Golf Links Business Park, Bengaluru, Karnataka 560071
Request Custom Transcript
IoT-Enabled Grocery Inventory Management: Real-Time Shelf Analytics & Shrinkage Prevention
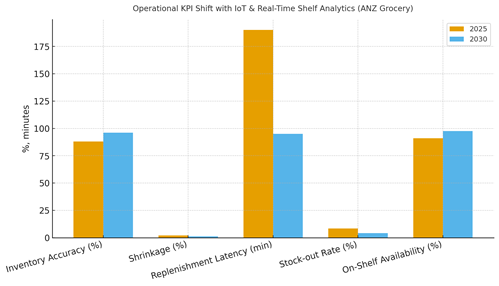
ANZ grocers are accelerating deployment of IoT sensors, computer vision, and shelf‑edge telemetry to fix the twin leaks of on‑shelf availability and shrinkage. Between 2025 and 2030, the stack coalesces around: (1) real‑time shelf analytics (camera/computer‑vision, weight sensors, and ESL telemetry), (2) connected backroom and cold‑chain monitoring, and (3) event streaming into replenishment, planogram, and workforce systems. We model ANZ spend on the IoT grocery inventory & shelf analytics stack expanding from ~US$0.72B (2025) to ~US$1.69B (2030), with Australia representing ~88% of regional spend. Value creation comes from fewer stock‑outs, faster replenishment, higher inventory accuracy, and reduced shrink (theft, damage, spoilage). Operational outcomes hinge on data quality and closed‑loop automation. Vision‑based gap detection and weight‑shelf deltas trigger pick tasks; cold‑chain sensors prevent spoilage by spotting temperature excursions; and RFID/ESL integrations keep planograms and price files synchronized. By 2030, median ANZ grocers can plausibly improve inventory accuracy from ~88% to ~96%, reduce stock‑outs from ~8.5% to ~4.2%, cut replenishment latency from ~190 to ~95 minutes, raise on‑shelf availability from ~91% to ~97.5%, and push shrinkage down from ~2.1% to ~1.2%, assuming disciplined process redesign and analytics ops. The bar chart in this report captures these directional shifts.
What's Covered?
Report Summary
Key Takeaways
1. Real‑time shelf analytics cut stock‑outs and drive faster, smarter replenishment tasking.
2. Shrinkage drops when vision + RFID + ESL synchronize counts, pricing, and planograms.
3. Cold‑chain sensors and SOPs prevent spoilage via early detection and corrective workflows.
4. ROI is proven on avoided lost sales, waste reduction, and labor efficiency not just devices.
5. Start with high‑value categories and cold‑chain, then scale to whole‑store RFID/ESL.
6. Edge processing + privacy‑aware camera placement are essential in ANZ regulatory contexts.
7. Closed‑loop automation matters: detection must trigger tasks, SLAs, and audits.
8. Track CFO‑grade KPIs: inventory accuracy, stock‑out %, shrink %, latency, and contribution margin.
Key Metrics

Market Size & Share
ANZ spend on IoT grocery inventory and shelf analytics is modeled to grow from ~US$0.72B in 2025 to ~US$1.69B in 2030. Australia dominates the regional market given store counts, digital investment, and vendor presence; New Zealand scales from a smaller base with strong food retail concentration. Within the stack, early spending centers on cold‑chain telemetry and computer‑vision gap detection in high‑velocity aisles; subsequent waves expand RFID and ESL to achieve real‑time counts, price sync, and planogram compliance. The line figure depicts the compounding spend trajectory.
Share dynamics: fresh and chilled categories command outsized investment due to shrink sensitivity; center store modernization follows as ESL and RFID costs decline. Retailers with mature data platforms convert device signals into replenishment and labor actions quickly, gaining share through higher on‑shelf availability and fewer lost sales. Execution risks include fragmented pilots that never close the loop to tasking, insufficient privacy controls, and device management sprawl. Winning share requires a portfolio approach: standardized device onboarding, clear SLAs, centralized monitoring, and common schemas for alerts and tasks.
Guidance: prioritize high‑margin/high‑loss categories first; budget for store‑ops enablement; and track contribution margin after shrink and waste reductions to validate reinvestment.

Market Analysis
Operational KPIs improve sharply when real‑time signals drive tasking. We model median inventory accuracy improving from ~88% to ~96% by 2030, shrinkage declining from ~2.1% to ~1.2% of sales, replenishment latency halving from ~190 to ~95 minutes, stock‑out rates falling from ~8.5% to ~4.2%, and on‑shelf availability rising from ~91% to ~97.5%. The bar chart summarizes these directional shifts. Enablers include: computer‑vision gap detection linked to task queues; weight‑shelf deltas for rapid facing checks; RFID/ESL synchronization; and cold‑chain telemetry with automated SOPs on excursions. Barriers include device maintenance, battery life, network reliability, and store‑operations adoption.
Financial lens: quantify avoided lost sales via substitution models and demand curves; measure spoilage/waste reduction with SKU‑level telemetry; and track labor minutes saved from automated counts. Experimentation: run store clusters as holdouts; rotate pilots across formats; and standardize success criteria (accuracy, latency, shrink, and contribution margin after fulfillment). Vendor strategy: prefer modular device + platform stacks with open APIs, model drift monitoring, and security baselines; negotiate uptime and MTTR SLAs.
Trends & Insights
1) Edge intelligence: on‑device inference reduces latency and bandwidth while keeping shopper images off the cloud. 2) Task‑centric orchestration: alerts must trigger prioritized work with SLAs and audit trails. 3) ESL everywhere: electronic shelf labels synchronize price files and planograms, cutting errors and labor. 4) RFID maturation: item/carton‑level tagging expands in high‑value categories first. 5) Cold‑chain discipline: temperature telemetry and route monitoring cut spoilage; solar‑assisted fridges/hubs reduce energy costs. 6) Privacy by design: camera placement, blurring, and retention rules align with ANZ expectations. 7) Unified data fabric: standard schemas across devices and stores prevent integration sprawl. 8) Micro‑forecasts: SKU‑ and day‑part‑level demand signals drive proactive replenishment. 9) Robotics adjacency: autonomous floor scanners and shelf‑scanning carts augment coverage. 10) CFO‑grade attribution: rigorous holdouts and SKU‑level baselines convert device signals into financial outcomes.
Segment Analysis
Fresh Produce & Bakery: Highest shrink sensitivity; prioritize CV gap detection, temperature monitoring, and fast tasking. Dairy & Chilled: Cold‑chain telemetry and ESL for promo price sync; item‑level tagging where ROI supports it. Meat & Seafood: Strict temperature SOPs; case‑ready monitoring and traceability. Beverages: High velocity; weight‑shelf sensors for facings; dynamic planograms. Health & Beauty/GM: RFID pilots for theft reduction and real‑time counts. Convenience Formats: Smaller footprints favor camera + ESL combos; rapid task cycles. Across segments, define alert thresholds, task SLAs, and audit trails; measure per‑segment inventory accuracy, stock‑out %, and shrink %.
Geography Analysis
Australia accounts for ~88% of ANZ IoT grocery spend by 2030, with New Zealand at ~12%. Within Australia, investment concentrates in metro regions (Sydney, Melbourne, Brisbane, Perth, Adelaide) where store density and supply chains support rapid rollout. Regional stores adopt selectively cold‑chain and ESL first then expand gap detection and RFID based on ROI. New Zealand’s adoption is strong in major chains with centralized operations and standardized formats. Localization: calibrate models for planogram variations and packaging differences; ensure network resilience in older buildings; and tailor privacy notices and signage to local expectations. The pie figure captures the modeled ANZ split.
Execution: centralize device management and monitoring; maintain regional spare parts and service coverage; and run region‑specific tests to adapt alert thresholds to local shopper patterns and labor models.

Competitive Landscape
Competitors span device makers (cameras, weight shelves, RFID, ESL), platform providers (CV analytics, IoT orchestration), and integrators (WMS/ERP/tasking). Incumbents with deep store networks scale via ESL + CV combos; challengers differentiate with edge inference, privacy tooling, and rapid tasking. Vendor selection should emphasize: open APIs, fleet management, security (zero‑trust device access), SLAs (uptime, MTTR, battery life), and model retraining workflows. Procurement guidance: run pilots with CFO‑grade success criteria; demand total cost of ownership transparency; and avoid single‑vendor lock‑in through modular contracts. Competitive KPIs include inventory accuracy delta vs baseline, shrink %, stock‑out %, replenishment latency, and contribution margin after shrink/waste and labor. Winners industrialize store‑ops enablement and close the loop from detection to task completion.
Report Details
Proceed To Buy
Want a More Customized Experience?
- Request a Customized Transcript: Submit your own questions or specify changes. We’ll conduct a new call with the industry expert, covering both the original and your additional questions. You’ll receive an updated report for a small fee over the standard price.
- Request a Direct Call with the Expert: If you prefer a live conversation, we can facilitate a call between you and the expert. After the call, you’ll get the full recording, a verbatim transcript, and continued platform access to query the content and more.
68 Circular Road, #02-01 049422, Singapore
Revenue Tower, Scbd, Jakarta 12190, Indonesia
4th Floor, Pinnacle Business Park, Andheri East, Mumbai, 400093
Cinnabar Hills, Embassy Golf Links Business Park, Bengaluru, Karnataka 560071
Request Custom Transcript
Related Transcripts


68 Circular Road, #02-01 049422, Singapore
Revenue Tower, Scbd, No.52-53, Jakarta 12190, Indonesia
Cinnabar Hills, Embassy Golf Links Business Park, Bengaluru, Karnataka 560071
4th Floor, Pinnacle Business Park, Andheri East, Mumbai, 400093


68 Circular Road, #02-01 049422, Singapore
Revenue Tower, Scbd, Jakarta 12190, Indonesia
4th Floor, Pinnacle Business Park, Andheri East, Mumbai, 400093
Cinnabar Hills, Embassy Golf Links Business Park, Bengaluru, Karnataka 560071