

68 Circular Road, #02-01 049422, Singapore
Revenue Tower, Scbd, Jakarta 12190, Indonesia
4th Floor, Pinnacle Business Park, Andheri East, Mumbai, 400093
Cinnabar Hills, Embassy Golf Links Business Park, Bengaluru, Karnataka 560071


Connect With Us


68 Circular Road, #02-01 049422, Singapore
Revenue Tower, Scbd, Jakarta 12190, Indonesia
4th Floor, Pinnacle Business Park, Andheri East, Mumbai, 400093
Cinnabar Hills, Embassy Golf Links Business Park, Bengaluru, Karnataka 560071
Connect With Us
68 Circular Road, #02-01 049422, Singapore
Revenue Tower, Scbd, Jakarta 12190, Indonesia
4th Floor, Pinnacle Business Park, Andheri East, Mumbai, 400093
Cinnabar Hills, Embassy Golf Links Business Park, Bengaluru, Karnataka 560071
Request Custom Transcript
Interactive Video Content Strategies: Personalization Algorithms & Viewer Retention Tactics
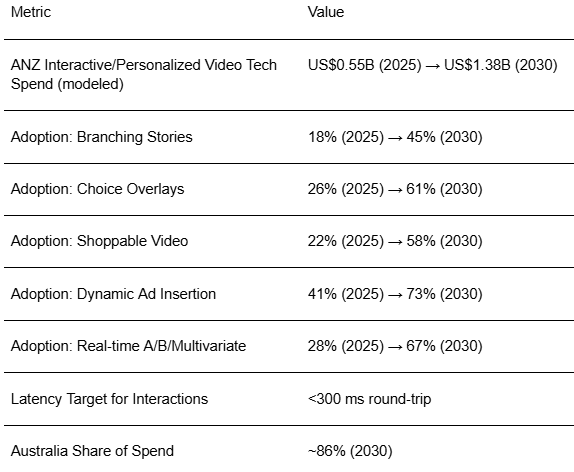
Interactive and personalized video is moving from novelty to retention engine across ANZ streamers, sports rights holders, broadcasters, education, and commerce publishers. The strategy stack for 2025–2030 combines (1) interaction layers branching narratives, choice overlays, polls, shoppable calls‑to‑action; (2) personalization algorithms content sequencing, thumbnails, and adaptive difficulty in educational content; and (3) experimentation real‑time A/B tests, multi-variates on scenes, and dynamic ad insertion tuned to viewer context. We model ANZ spend on interactive/personalized video technology rising from ~US$0.55B (2025) to ~US$1.38B (2030), led by Australia (~86% of spend) with New Zealand scaling from a smaller base. Retention economics dominate. Interactive sessions lengthen watch time, improve completion rates, and raise conversion on shoppable streams.
What's Covered?
Report Summary
Key Takeaways
1. Interactive layers + personalization algorithms lift watch time, completion, and shoppable CVR.
2. Scene‑level experimentation is the engine; creative ops must produce variant paths and prompts.
3. Choice architecture matters: clear, low‑cognitive‑load prompts outperform dense menus.
4. Latency budgets (<300 ms) and mobile‑first overlays are critical for ANZ viewing contexts.
5. Dynamic ad insertion should respect narrative beats to prevent retention drops.
6. Second‑screen and data‑sync features suit sports/live; avoid cluttering the primary feed.
7. CFO‑grade KPIs: incremental minutes watched, completion uplift, churn reduction, revenue/session.
8. Governance: disclosure for shoppable content, accessibility, and brand‑safety guardrails.
Key Metrics
Market Size & Share
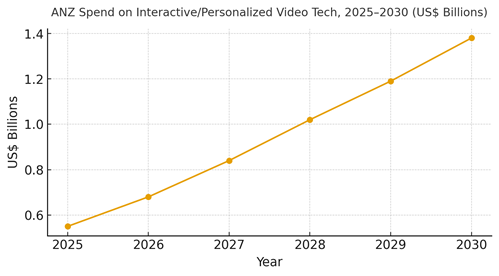
ANZ investment in interactive and personalized video infrastructure is modeled to grow from ~US$0.55B in 2025 to ~US$1.38B by 2030, driven by streamers, broadcasters, sports rights holders, ed‑tech, and commerce publishers. Australia accounts for the vast majority of spend (~86%) given market size and vendor concentration, with New Zealand expanding adoption in education, news, and public media. Share dynamics within the stack: player SDKs and interactive layers scale early; experimentation and personalization engines accelerate with content graph maturity; dynamic ad insertion becomes standard in premium inventory. The line figure visualizes the compounding trajectory.
Use‑case share: entertainment and sports lead absolute spend; education and commerce experience the fastest growth due to measurable ROI (completion, assessment pass‑through, and conversion). Leaders build a content graph that tags scenes with entities, beats, and intents enabling personalization to sequence scenes and dynamically render overlays. Execution risks include under‑resourced creative ops (few variants to test), inconsistent metadata, and latency that degrades interaction quality. Governance requires disclosure for shoppable content and alignment of ad insertion with narrative beats to avoid retention drops.
How to win share: invest first in metadata quality and creative variant pipelines; then scale testing cadence and decisioning. Align KPIs with revenue and churn outcomes (incremental minutes watched, completion uplift, session revenue).
Market Analysis
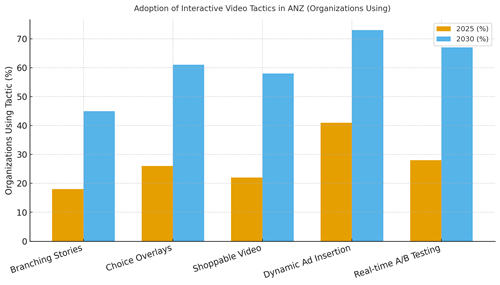
Adoption of interactive tactics is projected to broaden through 2030. We model branching stories from ~18% to ~45% of organizations, choice overlays from ~26% to ~61%, shoppable video from ~22% to ~58%, dynamic ad insertion from ~41% to ~73%, and real‑time A/B/multivariate testing from ~28% to ~67%. Early wins appear in entertainment formats that tolerate alternate cuts and optional choices, in sports with second‑screen stats and polls, and in education where adaptive quizzes and branching modules improve pass‑through. Commerce experiences meaningful gains in shoppable sessions when prompts are sparse and well‑timed. Barriers include creative throughput, metadata debt, and latency budgets not enforced across devices.
Financial lens: optimize to incremental minutes watched, completion uplift, churn reduction, and revenue per interactive session not raw interaction counts. Run disciplined experiments with narrative‑safe guardrails (no mid‑climax prompts), cap ad frequency, and align ad slots to scene boundaries. Vendor approach: use modular stacks (player SDK + interactivity + personalization + ad decisioning + analytics) to avoid lock‑in. The bar chart summarizes the expected adoption shift across core tactics by 2030.
Trends & Insights
1) Content graphs as the foundation: scene/entity/beat tagging enables personalization and clean ad insertion. 2) Choice minimalism: fewer, clearer prompts outperform dense menus and protect narrative flow. 3) Second‑screen design: live sports and events shift interaction to companion apps to preserve primary feed integrity. 4) Shoppable beyond retail: media companies embed commerce via curated product placements and synchronized calls‑to‑action. 5) Adaptive learning: ed‑tech uses branching and difficulty adjustment to raise completion and assessment outcomes. 6) Creative ops pipelines: variant cuts, thumbnail tests, and localized overlays become routine. 7) Data privacy and disclosure: transparent signals for personalization and clear shoppable labels. 8) Latency management: edge delivery and lightweight overlays keep round‑trip under 300 ms. 9) Accessibility by default: captions, audio description, and keyboard/remote navigation. 10) Outcome‑based budgeting: content is funded against retention and commerce goals, not just views.
Segment Analysis
Entertainment & Streaming: Interactive arcs and optional endings work for certain genres; always preserve a canonical cut. Sports: Second‑screen stats, polls, predictive games, and synchronized data overlays; keep primary feed uncluttered. Education/Ed‑tech: Branching quizzes and adaptive difficulty; completion and pass‑through gains justify investment. News & Public Media: Issue explainers with choice overlays; disclosure and neutrality rules apply. Commerce & Retail: Shoppable highlights and creator‑led live streams; minimal prompts and post‑view retargeting. Fitness & Wellness: Personalized pacing, reps, and recovery cues; device integrations. Across segments, define guardrails for narrative integrity, ad placement, and accessibility; track per‑segment KPIs (minutes watched, completion, churn, session revenue).
Geography Analysis
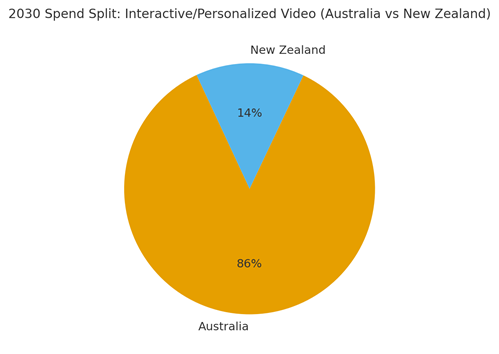
Within ANZ, Australia drives ~86% of interactive video spend by 2030, with New Zealand contributing ~14%. Australian investment concentrates in entertainment, sports, and commerce video; NZ expands in education and news/public media. City‑level nuance: Sydney/Melbourne lead vendor presence and experimental budgets; Brisbane/Perth scale sports and events; NZ’s Auckland/Wellington emphasize education and public broadcasters. Localization principles: optimize overlays for mobile, ensure caption quality, and tailor shoppable integrations to local payments. Compliance: clear disclosure for shoppable content; accessibility standards for captions and navigation. The pie figure reflects the modeled split between Australia and New Zealand.
Execution: centralize content graphs and experimentation frameworks while allowing local teams to control creative ops and partner integrations. Measure region‑specific KPIs (completion uplift, churn reduction, session revenue) and iterate feature rollouts accordingly.
Competitive Landscape
Stacks converge around player SDKs, interactivity engines, personalization/decisioning, ad tech (DAI/SSAI), and analytics. Incumbent streamers and broadcasters integrate interactivity into owned players; challengers differentiate on shoppable integrations and real‑time testing depth. Differentiation vectors: (1) metadata tooling and scene editors, (2) low‑latency overlays and edge delivery, (3) clean ad decisioning synced to beats, (4) accessibility and compliance features, (5) modular integrations to avoid lock‑in. Procurement guidance: demand APIs and event schemas, measure vendor impact on minutes watched/completion, and require latency SLOs. Competitive KPIs: incremental minutes watched, completion uplift, churn reduction, shoppable CVR, and revenue per interactive session. Winners in 2025–2030 will industrialize creative variant pipelines and treat experimentation as a weekly cadence.
Report Details
Proceed To Buy
Want a More Customized Experience?
- Request a Customized Transcript: Submit your own questions or specify changes. We’ll conduct a new call with the industry expert, covering both the original and your additional questions. You’ll receive an updated report for a small fee over the standard price.
- Request a Direct Call with the Expert: If you prefer a live conversation, we can facilitate a call between you and the expert. After the call, you’ll get the full recording, a verbatim transcript, and continued platform access to query the content and more.
68 Circular Road, #02-01 049422, Singapore
Revenue Tower, Scbd, Jakarta 12190, Indonesia
4th Floor, Pinnacle Business Park, Andheri East, Mumbai, 400093
Cinnabar Hills, Embassy Golf Links Business Park, Bengaluru, Karnataka 560071
Request Custom Transcript
Related Transcripts

$ 1395


68 Circular Road, #02-01 049422, Singapore
Revenue Tower, Scbd, No.52-53, Jakarta 12190, Indonesia
Cinnabar Hills, Embassy Golf Links Business Park, Bengaluru, Karnataka 560071
4th Floor, Pinnacle Business Park, Andheri East, Mumbai, 400093


68 Circular Road, #02-01 049422, Singapore
Revenue Tower, Scbd, Jakarta 12190, Indonesia
4th Floor, Pinnacle Business Park, Andheri East, Mumbai, 400093
Cinnabar Hills, Embassy Golf Links Business Park, Bengaluru, Karnataka 560071