

68 Circular Road, #02-01 049422, Singapore
Revenue Tower, Scbd, Jakarta 12190, Indonesia
4th Floor, Pinnacle Business Park, Andheri East, Mumbai, 400093
Cinnabar Hills, Embassy Golf Links Business Park, Bengaluru, Karnataka 560071


Connect With Us


68 Circular Road, #02-01 049422, Singapore
Revenue Tower, Scbd, Jakarta 12190, Indonesia
4th Floor, Pinnacle Business Park, Andheri East, Mumbai, 400093
Cinnabar Hills, Embassy Golf Links Business Park, Bengaluru, Karnataka 560071
Connect With Us
68 Circular Road, #02-01 049422, Singapore
Revenue Tower, Scbd, Jakarta 12190, Indonesia
4th Floor, Pinnacle Business Park, Andheri East, Mumbai, 400093
Cinnabar Hills, Embassy Golf Links Business Park, Bengaluru, Karnataka 560071
Request Custom Transcript
Hyperlocal Delivery Networks: Dark Store Optimization & Last-Mile Robotics in Urban India
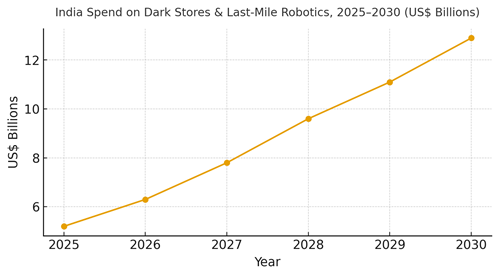
India’s hyperlocal delivery market is scaling beyond speed promises toward resilient unit economics. The next cycle (2025–2030) is defined by dark‑store optimization slotting, pick‑path engineering, micro‑fulfillment and a pragmatic wave of last‑mile automation using robots, vision‑guided sorters, and EV fleets. We model combined operating + capex spend on dark stores and last‑mile robotics rising from ~US$5.2B in 2025 to ~US$12.9B by 2030, concentrated in Delhi‑NCR, Mumbai‑Pune, Bengaluru‑Chennai‑Hyderabad, and Kolkata corridors. Networks aim to compress delivery cost per km, reduce turnaround time (TAT), and lift dark‑store throughput while maintaining high order accuracy. Operationally, dark‑store maturity shifts from manual batching to algorithmic pick‑waves with heat‑map slotting, zone picking, and dynamic labor planning. Robotics focuses on constrained problems with near‑term ROI: automated put‑to‑wall, belt sorters with computer vision, and limited sidewalk/closed‑campus bots. EV penetration in fleets rises sharply, aided by swappable batteries and depot charging.
What's Covered?
Report Summary
Key Takeaways
1. Shift from speed marketing to reliability economics: cost/km, TAT, and accuracy are north‑star KPIs.
2. Dark‑store optimization (slotting, wave picking, zoning) yields step‑changes in throughput and accuracy.
3. Robotics wins in constrained tasks (put‑to‑wall, sortation); sidewalk bots limited to campuses/controlled zones.
4. EV fleets dominate last mile with depot charging and swaps; route engines incorporate micro‑windows and traffic.
5. Micro‑catchments (1–3 km) lower variance; SKU rationalization and private labels protect margin.
6. Measure incrementality: cost‑to‑serve, re‑attempt rate, and cycle‑time compression not just orders served.
7. Governance: urban permits, battery recycling, road‑use safety, and worker enablement are essential.
8. Sustainable promise: profitable 20–40 minute windows beat unsustainable 10‑minute targets.
Key Metrics

Market Size & Share
India’s hyperlocal delivery capex + operating outlays for dark stores and last‑mile robotics are modeled to rise from ~US$5.2B in 2025 to ~US$12.9B by 2030, reflecting expansion of micro‑fulfillment footprints, EV fleets, and automation. Share concentrates in Delhi‑NCR, Mumbai‑Pune‑Ahmedabad, and the Southern corridor (Bengaluru‑Chennai‑Hyderabad), where order density supports high throughput and shorter radii. East (Kolkata cluster) scales more gradually; Tier‑2/3 cities deliver double‑digit growth off smaller bases as density improves. Within the pool, dark‑store optimization (slotting, wave picking, zoning) commands the largest share initially; robotics and EV scale faster from 2027 onward as vendors localize hardware and reduce total cost of ownership. The line figure shows the compounding investment trajectory through 2030.
Execution: portfolios should stage investments first re‑platform WMS/OMS and demand forecasting; then deploy zone maps and pick‑waves; next, automate sortation and put‑to‑wall; finally, pilot sidewalk/closed‑campus bots. Share shifts toward networks that fuse inventory learning with routing and labor planning, yielding fewer stock‑outs and faster cycles. Leaders align pricing with reliability (20–40 minute windows) rather than extreme speed. Measurement focuses on cost‑to‑serve, on‑time %, and re‑attempt reductions.
Market Analysis
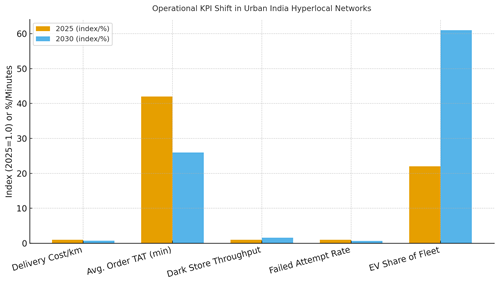
Operational KPIs improve as networks standardize WMS/OMS, adopt heat‑map slotting, and algorithmic pick‑waves. Median delivery cost/km falls to ~0.72× by 2030 via micro‑catchments and EV adoption; average TAT compresses from ~42 to ~26 minutes with better batching and micro‑windowing; dark‑store throughput rises ~55% with zoning and put‑to‑wall; failed‑attempts drop ~35% through address intelligence and delivery preference capture; EV share reaches ~61% as charging/swap infrastructure matures. Robotics adoption is pragmatic: sorters and vision QC scale first; AMRs expand in larger facilities; sidewalk bots remain limited to campuses and controlled zones. Barriers include real‑estate constraints, grid limitations, fragmented addresses, and curb‑space policy.
Financial lens: model ROI against cycle‑time compression, labor reallocation, accuracy improvement, and safety gains not merely headcount reduction. Stage‑gate approvals should require pilot metrics on TAT, re‑attempts, and maintenance cost. Vendor strategy: prefer modular routing, WMS, and robotics stacks with open APIs; negotiate SLAs for uptime and battery performance. The bar chart summarizes a plausible median shift across key KPIs by 2030.
Trends & Insights
1) Reliability over extreme speed: customers reward dependable 20–40 minute windows; penalties for misses drive accurate ETAs over aggressive promises. 2) Micro‑catchments (1–3 km): reduce variance in routing; enable higher courier utilization and lower cost/km. 3) EV mainstreaming: depot charging and swappable batteries improve uptime and sustainability. 4) Robotics pragmatism: sortation and vision QC lead; AMRs and picker assistance follow in larger sites. 5) Address intelligence: plus codes, geofencing, and delivery preferences reduce re‑attempts. 6) Inventory learning: pincode‑level demand models cut stock‑outs and enable SKU rationalization; private‑label expansion protects margins. 7) Safety & compliance: standardized SOPs for bots/EVs and rider PPE; battery recycling programs expand. 8) Pricing science: micro‑windows priced by demand and rider capacity smooth peaks. 9) Last‑yard innovations: locker banks and secure unattended delivery pilots reduce failed attempts. 10) Data unification: OMS/WMS/routing/CS systems integrate for shared KPIs.
Segment Analysis
Grocery & Essentials: Highest order frequency; benefits from slotting, cold‑chain handling, and private‑label mixes. Foodservice: Peak‑heavy; dispatch and batching logic critical; EV scooters and insulated carriers standardize quality. Pharmacy & Health: Compliance‑centric workflows, temperature control, and ID verification; robotics aids accuracy. Electronics & Small Appliances: Damage‑aware packaging and appointment windows; limited robotics in pick‑to‑light. Fashion & Beauty: Returns handling and size exchanges; lockers reduce re‑attempts; micro‑fulfillment supports seasonal spikes. Specialty Retail (pets, stationery): Lower volumes; cluster‑based routing reduces dead‑kilometers. Across segments, define SLA tiers and micro‑window pricing; track per‑segment KPIs such as on‑time %, re‑attempts, damaged/expired rate, and contribution margin after fulfillment. Pilot robotics where pick density and repeatability justify CAPEX; otherwise, focus on process and software uplift first.
Geography Analysis
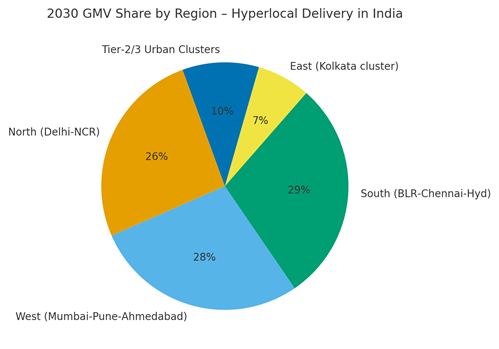
By 2030, GMV concentrates in North (Delhi‑NCR ~26%), West (Mumbai‑Pune‑Ahmedabad ~28%), and South (Bengaluru‑Chennai‑Hyderabad ~29%). East (Kolkata cluster ~7%) and Tier‑2/3 urban clusters (~10%) expand as density and dark‑store coverage improve. City‑level nuance: Delhi‑NCR excels in order density but faces curb‑space constraints; Mumbai’s real‑estate pressure favors smaller micro‑fulfillment footprints; Bengaluru/Hyderabad tilt toward automation early due to tech vendor proximity; Chennai balances EV readiness with port logistics; Kolkata scales with address normalization initiatives. Tier‑2/3 cities rely on shared dark stores and hub‑and‑spoke hybrids.
Localization principles: design micro‑catchments by traffic patterns and natural barriers; align charging depots with grid capacity; coordinate with municipal rules on curb space and sidewalk robots. Measure geography‑specific KPIs (on‑time %, cost/km, re‑attempts) and iterate network design quarterly. The pie chart shows the modeled GMV share across Indian regions in 2030.
Competitive Landscape
Stacks converge around OMS/WMS, inventory forecasting, routing/labor planning, robotics (sortation/AMR), and EV fleet ops. Incumbents with dense store footprints and mature WMS integrate robotics incrementally; challengers differentiate with software‑first optimization and flexible real‑estate models. Vendor differentiation: (1) open APIs and fast integration; (2) battery/charging reliability; (3) safety/compliance toolkits; (4) maintenance SLAs; (5) inventory learning quality. Procurement guidance: run pilot scorecards on cycle time, accuracy, and maintenance cost; demand uptime SLAs and battery guarantees; and avoid vendor lock‑in via modular contracts. Competitive KPIs: cost‑to‑serve, on‑time %, re‑attempt rate, throughput per labor hour, and maintenance cost per order. Winners in 2025–2030 will be those who sequence process, software, and robotics in the right order and price reliability not extreme speed as the core promise.
Report Details
Proceed To Buy
Want a More Customized Experience?
- Request a Customized Transcript: Submit your own questions or specify changes. We’ll conduct a new call with the industry expert, covering both the original and your additional questions. You’ll receive an updated report for a small fee over the standard price.
- Request a Direct Call with the Expert: If you prefer a live conversation, we can facilitate a call between you and the expert. After the call, you’ll get the full recording, a verbatim transcript, and continued platform access to query the content and more.
68 Circular Road, #02-01 049422, Singapore
Revenue Tower, Scbd, Jakarta 12190, Indonesia
4th Floor, Pinnacle Business Park, Andheri East, Mumbai, 400093
Cinnabar Hills, Embassy Golf Links Business Park, Bengaluru, Karnataka 560071
Request Custom Transcript
Related Transcripts

$ 1395


68 Circular Road, #02-01 049422, Singapore
Revenue Tower, Scbd, No.52-53, Jakarta 12190, Indonesia
Cinnabar Hills, Embassy Golf Links Business Park, Bengaluru, Karnataka 560071
4th Floor, Pinnacle Business Park, Andheri East, Mumbai, 400093


68 Circular Road, #02-01 049422, Singapore
Revenue Tower, Scbd, Jakarta 12190, Indonesia
4th Floor, Pinnacle Business Park, Andheri East, Mumbai, 400093
Cinnabar Hills, Embassy Golf Links Business Park, Bengaluru, Karnataka 560071