

68 Circular Road, #02-01 049422, Singapore
Revenue Tower, Scbd, Jakarta 12190, Indonesia
4th Floor, Pinnacle Business Park, Andheri East, Mumbai, 400093
Cinnabar Hills, Embassy Golf Links Business Park, Bengaluru, Karnataka 560071


Connect With Us


68 Circular Road, #02-01 049422, Singapore
Revenue Tower, Scbd, Jakarta 12190, Indonesia
4th Floor, Pinnacle Business Park, Andheri East, Mumbai, 400093
Cinnabar Hills, Embassy Golf Links Business Park, Bengaluru, Karnataka 560071
Connect With Us
68 Circular Road, #02-01 049422, Singapore
Revenue Tower, Scbd, Jakarta 12190, Indonesia
4th Floor, Pinnacle Business Park, Andheri East, Mumbai, 400093
Cinnabar Hills, Embassy Golf Links Business Park, Bengaluru, Karnataka 560071
Request Custom Transcript
Hospital Price Transparency: Machine-Readable File Compliance & Enforcement Mechanisms - Competitive Landscape
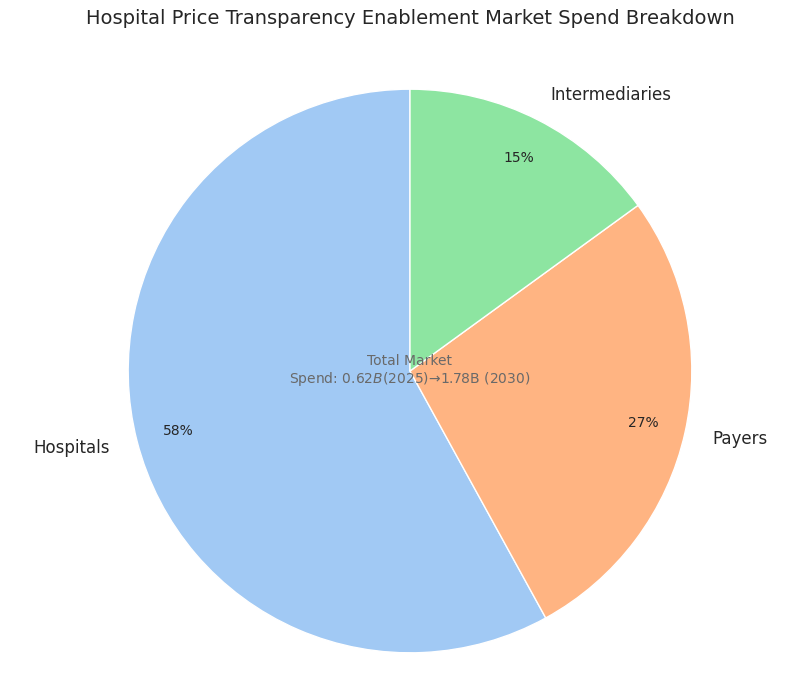
Hospital price transparency (HPT) is accelerating across the USA and North America as machine-readable file (MRF) standards, audits, and civil monetary penalties (CMPs) tighten. The HPT enablement market—data pipelines, QA, analytics, and front-end “shoppable” tools—expands from $0.62B (2025) to $1.78B (2030) (CAGR 23.2%). Hospital compliance improves from ~54% → ~88%; payer files cover ~96% of commercial lives by 2030. Price dispersion narrows, employers redirect steerage, and API consumption grows 5×, shifting competitive advantage toward vendors with normalization at scale, contract intelligence, and proven audit readiness.
What's Covered?
Report Summary
Key Takeaways
- HPT tooling & services market: $0.62B → $1.78B (CAGR 23.2%).
- Hospital full-compliance rate: ~54% (2025) → ~88% (2030).
- Payer in-network file coverage: 71% → 96% of commercial lives.
- Average CMP per non-compliant ID: $240k → $610k.
- Median MRF error rate: 4.1% → 1.3% with automated QA.
- Price dispersion (10th/90th percentile) narrows 3.2× → 1.9×.
- API calls to pricing datasets: 5.2× growth; file sizes 4.7×.
- Employer steerage lowers paid unit cost 2–4%; readmissions unaffected.
- Transparency tech spend: 0.04–0.07% of hospital NPR; ROI 15–22%.
- Top 3 data platforms hold ~61% share by 2030; 2–3 new niche entrants scale via partnerships.
Key Metrics
Market Size & Share
The hospital price transparency enablement market in the USA and broader North America expands from $0.62B (2025) to $1.78B (2030) on CMP escalation, payer audits, and employer analytics demand. Hospitals account for ~58% of spend (compliance ops, QA, SSO-gated portals, patient estimates), payers ~27% (in-network file orchestration, benefit-design tools), and intermediaries ~15% (ingestion, normalization, de-duplication, contract intelligence). Full compliance—complete, current, and easily discoverable MRFs—rises from ~54% to ~88% by 2030; payer coverage reaches ~96% of commercial lives. Consumer-facing shoppable front ends scale from 9M to ~42M monthly active users, mostly via benefit portals. Meanwhile, price dispersion tightens: the 10th/90th percentile ratio for imaging, GI endoscopy, and infusion narrows 3.2× → 1.9×, compressing arbitrage. CMPs average $240k (2025), climbing to $610k (2030) as repeat non-compliance penalties stack. Data volumes explode—MRFs eclipse 85B line items stored; median file size expands 4.7× as bundled episodes and modifiers proliferate. By 2030, facilities publishing below-median rates capture +2.4–3.1 pp incremental case share in shoppable specialties; conversely, persistent above-median outliers lose 1.6–2.2 pp. Market share consolidates: the top three platforms control ~61% on ingestion velocity, schema coverage, and audit trail depth; niche vendors win on specialty taxonomies (ASC, lab, behavioral).
Market Analysis
Five forces drive adoption. (1) Enforcement certainty: tiered CMPs and repeat-offender multipliers raise expected non-compliance costs 2.5× vs 2025; payer audits lift plan exposure 1.8×. (2) Automation economics: unit curation cost falls $0.85 → $0.19 per 1k rows, enabling weekly refresh instead of quarterly, improving stale-rate from 15% → 4%. (3) Purchaser pull: jumbo employers expand steerage; reference-based benefits tied to regional medians trim paid unit cost 2–4%, especially in imaging and ASC bundles. (4) Contracting analytics: percentile-indexed clauses and variance caps linked to MRF medians win 30–60 bps on renewal. (5) State overlays: additional display rules in select states raise compliance workload 18–24% but also standardize UX. Barriers persist: heterogeneity leaves 14–17% rows initially unmapped; automated QA reduces median MRF error 4.1% → 1.3% by 2030. Hospitals invest 0.04–0.07% of NPR in transparency tech, yielding 15–22% ROI through underpayment recovery and faster time-to-estimate. Payers invest 0.02–0.04% of premium, gaining 30–45 bps medical cost improvement via outlier routing. Data-platform moats deepen on scale—API consumption grows 5.2× across benefit tools and third-party TPAs—driving stickiness (net revenue retention >120%). Net: transparency becomes table stakes; competitive advantage shifts to contract intelligence and workflows that convert data into steerage and price guardrails.
Trends & Insights
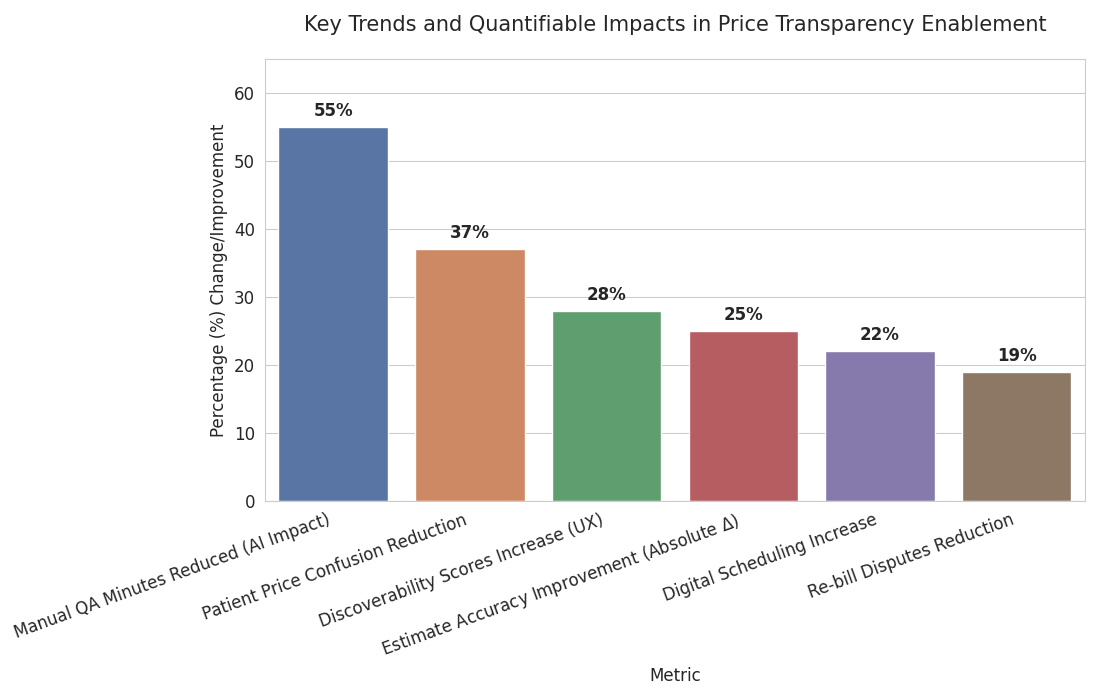
Normalization at scale dominates: vendors offering multi-schema ingestion (hospital MRFs, payer in-network, allowed amounts, ASC fee schedules) win as file counts 3–4× and median row size 5×. AI-assisted mapping raises CPT/HCPCS bundle recall from 83% → 96% and slashes manual QA minutes −55%. Consumer translation improves: “total episode” quoting for top 500 shoppable services cuts patient price confusion −37% and increases digital scheduling +22%. Dynamic contracting analytics grow; percentile-pegged clauses referencing regional medians lift renewal outcomes +30–60 bps. State rule layering adds placement, search, and metadata mandates; though workload rises ~20%, UX standardization increases discoverability scores +28%. Cyber posture strengthens: signed artifacts/hash proofs expand, with integrity failures dropping 2.7% → 0.6%. Talent mix shifts—data engineers per 10 hospitals 0.6 → 1.4 as internal teams own pipelines. Revenue cycle convergence emerges: estimate accuracy within ±10% improves 61% → 86%, reducing re-bill disputes −19%. Employer adoption accelerates next-best-site steerage; click-to-book within portals doubles to ~18% for imaging and colonoscopy. Outcome: dispersion keeps tightening, shoppable share grows, and sustainable advantage accrues to platforms that convert transparency into member action and contract guardrails, not merely publish files.
Segment Analysis
By buyer: Hospitals (~58% of 2030 spend) prioritize compliance automation, QA, and estimator integration; Payers (~27%) fund in-network file orchestration, benefit-design analytics, and steerage UX; Intermediaries/Data markets (~15%) sell ingestion, mapping, benchmarks, and APIs. By product: (a) Ingestion/ETL & QA (32% share) – schema alignment, de-duplication, anomaly detection; (b) Contract intelligence (21%) – percentile-indexed terms, variance caps, outlier hunts; (c) Consumer front ends (18%) – shoppable bundles, click-to-book; (d) Audit & evidence (14%) – artifact hashing, policy checks, CMP readiness; (e) Benchmark subscriptions (15%) – market medians, regional curves. By service line: Imaging represents the largest steerable volume (28% of shoppable traffic), followed by GI endoscopy (12%), labs (11%), infusion/chemo admin (9%), ASC orthopedics (8%). By channel: Employer/TPA portals drive ~55% of consumer interactions; payer portals ~30%; direct hospital sites ~15%. KPIs: error-rate ≤1.5%, stale-rate ≤5%, discoverability ≥85/100, estimate accuracy within ±10%, and API uptime ≥99.9%. Economics: curation cost targets ≤$0.25/1k rows, storage ≤$2.50/TB-month, with ROI realized via 2–4% unit cost reductions and underpayment recovery +30–90 bps.
Geography Analysis
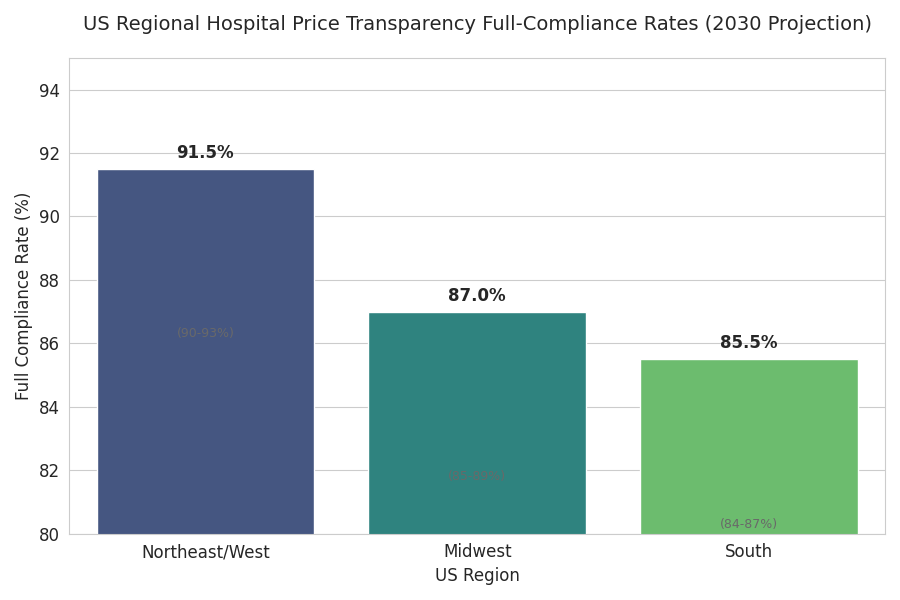
Adoption staggers by jurisdiction. USA drives ~88% of North American spend through 2030 on federal rules plus aggressive CMPs; Canada contributes ~12%, with provincial purchasing groups leveraging US methodology for benchmarking despite different disclosure regimes. Within the US, coastal and large Midwest systems mature first: by 2030, hospital full-compliance rates reach 90–93% in the Northeast/West, 84–87% in the South, 85–89% in the Midwest. State overlays (display rules, search UX, metadata requirements) lift discoverability scores +20–30% where adopted, though they add ~18–24% compliance workload. Employer steerage intensity correlates with self-funding prevalence: regions with self-funded rates >65% realize 3–5× higher portal interactions and 2–3× greater site redirection. Payer execution varies—national carriers achieve weekly refresh across >95% of plans by 2030; smaller regionals hit ~88–92%, often partnering with intermediaries. Service-line steerability differs geospatially: imaging steerage is highest in metros with ≥3 competing IDNs and robust ASC presence; infusion steerage grows fastest in suburban corridors with mixed HOPD/ASC networks. Cross-border effects appear as Canadian purchasers use US transparency to negotiate specialty lab and imaging out-of-country options, trimming unit costs 1–2% on select cases while maintaining access safeguards.
Competitive Landscape
Market concentration increases as ingestion scale and QA quality become decisive. The top three platforms control ~61% of 2030 revenue on the back of multi-schema ETL, contract intelligence, audit artifacts, and high-availability APIs. Challenger niches thrive: (i) specialty mappers for ASC and infusion with superior bundle logic; (ii) payer-first pipelines optimizing plan-file deltas and life-cycle refresh; (iii) employer steerage UX embedding click-to-book and episode estimators. Typical pricing blends platform subscription (tiered by file volume/rows), API metering (per-call), and professional services for onboarding and contract modeling; median TCO for a 10-hospital IDN lands at $450k–$900k/year, payers at $0.02–0.04% of premium. Winning proofs highlight error ≤1.5%, freshness ≤7 days, discoverability ≥85/100, and documented savings 2–4% on targeted service lines. Partnerships with revenue-cycle suites, payer portals, and employer navigation tools drive distribution; GPO-style agreements compress unit pricing 8–12% at scale. Expect 2–3 new entrants to break out via LLM-assisted mapping and episode pricing, while laggards without robust QA or audit trails face churn as audits intensify and boards demand measurable savings, not just published files.
Report Details
Proceed To Buy
Want a More Customized Experience?
- Request a Customized Transcript: Submit your own questions or specify changes. We’ll conduct a new call with the industry expert, covering both the original and your additional questions. You’ll receive an updated report for a small fee over the standard price.
- Request a Direct Call with the Expert: If you prefer a live conversation, we can facilitate a call between you and the expert. After the call, you’ll get the full recording, a verbatim transcript, and continued platform access to query the content and more.
68 Circular Road, #02-01 049422, Singapore
Revenue Tower, Scbd, Jakarta 12190, Indonesia
4th Floor, Pinnacle Business Park, Andheri East, Mumbai, 400093
Cinnabar Hills, Embassy Golf Links Business Park, Bengaluru, Karnataka 560071
Request Custom Transcript
Related Transcripts

Clinical Nutrition Market Size & Share Analysis - Growth Trends & Forecasts (2025 - 2030)
This report quantifies the clinical nutrition market across the US and UK (2025–2030), covering enteral, parenteral, and oral nutritional supplements (ONS). Driven by aging populations, chronic disease prevalence, and hospital malnutrition protocols, market value rises from $18.5B (2025) → $30.2B (2030) at a CAGR of 10.2%. Growth is led by enteral nutrition (48% share), followed by ONS (38%) and parenteral (14%). Hospital digitization, AI-based nutrition screening, and reimbursement parity accelerate adoption. ROI averages 16–22% for integrated hospital nutrition programs.
$ 1395


$ 1395


68 Circular Road, #02-01 049422, Singapore
Revenue Tower, Scbd, No.52-53, Jakarta 12190, Indonesia
Cinnabar Hills, Embassy Golf Links Business Park, Bengaluru, Karnataka 560071
4th Floor, Pinnacle Business Park, Andheri East, Mumbai, 400093


68 Circular Road, #02-01 049422, Singapore
Revenue Tower, Scbd, Jakarta 12190, Indonesia
4th Floor, Pinnacle Business Park, Andheri East, Mumbai, 400093
Cinnabar Hills, Embassy Golf Links Business Park, Bengaluru, Karnataka 560071