

68 Circular Road, #02-01 049422, Singapore
Revenue Tower, Scbd, Jakarta 12190, Indonesia
4th Floor, Pinnacle Business Park, Andheri East, Mumbai, 400093
Cinnabar Hills, Embassy Golf Links Business Park, Bengaluru, Karnataka 560071


Connect With Us


68 Circular Road, #02-01 049422, Singapore
Revenue Tower, Scbd, Jakarta 12190, Indonesia
4th Floor, Pinnacle Business Park, Andheri East, Mumbai, 400093
Cinnabar Hills, Embassy Golf Links Business Park, Bengaluru, Karnataka 560071
Connect With Us
68 Circular Road, #02-01 049422, Singapore
Revenue Tower, Scbd, Jakarta 12190, Indonesia
4th Floor, Pinnacle Business Park, Andheri East, Mumbai, 400093
Cinnabar Hills, Embassy Golf Links Business Park, Bengaluru, Karnataka 560071
Request Custom Transcript
Dynamic Working Capital Financing Platforms: Supply Chain Risk Mitigation & Cash Flow Optimization - Supply Chain Logistics
From 2025 to 2030, Asia-Pacific working capital financing will be transformed by AI-driven liquidity platforms, expanding from approximately $140 billion to $440 billion. India is at the forefront due to TReDS reforms and Open Account Trade systems, with its market expected to grow from about $28 billion to $130 billion. The transformation is fueled by real-time risk analysis using logistics data and government-backed digital supply-chain platforms for SMEs. By 2030, systems will automate credit risk pricing, early payment flows, and receivable tokenization, boosting resilience and liquidity across SME networks.
What's Covered?
Report Summary
Key Takeaways
• AI-driven liquidity scoring integrates logistics, invoices, and payments for real-time risk management.
• India’s open-finance rails become the blueprint for scalable APAC WC ecosystems.
• Dynamic credit pricing replaces static supplier limits in high-volatility markets.
• Invoice tokenization creates tradeable liquidity instruments and secondary markets.
• SME onboarding accelerates via GST and e-invoicing data interoperability.
• Cross-border corridors adopt API-based credit verification and FX-linked pricing.
• Corporate treasury systems integrate dynamic WC APIs for continuous optimization.
• Platform resilience and ESG-linked transparency define investor confidence.
Key Metrics
Market Size & Share

The WC financing market in APAC is projected to expand from ~$140B (2025) to ~$440B (2030), with India contributing nearly 30% of incremental volume. The shift is led by embedded lending architectures and improved data transparency. India’s policy stack—comprising e-invoicing, GSTN data, Account Aggregator APIs, and TReDS regulation—creates the foundation for scalable digital liquidity. China, Southeast Asia, and Australia follow with sector-specific models around export receivables, logistics finance, and invoice discounting.
Share dynamics highlight India’s growing influence, with its share rising from ~20% in 2025 to ~30% by 2030. Open-finance rail interoperability (UPI, OCEN, ONDC) and low-cost onboarding accelerate inclusion of SMEs and logistics intermediaries, reinforcing India’s leadership as a data-rich, API-first credit ecosystem.
Market Analysis

Manufacturing and retail account for over 45% of platform-linked WC volume by 2030, reflecting dense supply networks and predictable receivables flows. Logistics and agri/food sectors emerge as growth frontiers—logistics due to fleet and shipment data integration, and agri/food due to trade marketplace digitization. Pharma scales via export receivables and regulatory-grade supplier verification. India’s industry mix shifts from buyer-led to supplier-led credit activation as risk scoring becomes automated.
In the rest of APAC, digital trade platforms and B2B marketplaces drive volume. Regional diversity persists—China dominates manufacturing and export credit, while Southeast Asia scales logistics and SME trade finance via embedded lending in e-commerce ecosystems.
Trends & Insights
• Shift from static to dynamic risk models using logistics and IoT data.
• Open-finance and digital ID infrastructure drive SME inclusion.
• Receivable tokenization and blockchain-based liquidity pools gain traction.
• ESG-linked WC lending frameworks influence investor participation.
• AI-driven supplier scoring becomes standard for procurement-finance convergence.
• API orchestration reduces friction between banks, NBFCs, and corporates.
• Embedded finance partnerships reshape working capital distribution.
• Digital corridors (India-ASEAN, Japan-Korea) emerge for trade-linked liquidity.
Segment Analysis
• Manufacturing: Anchors dynamic discounting, ESG compliance, and invoice visibility.
• Retail: Uses embedded WC for omni-channel procurement and supplier credit.
• Logistics: Gains liquidity via shipment-linked payments and receivable factoring.
• Pharma: Leverages export receivables and compliance-linked financing.
• Agri & Food: Uses trade marketplaces for factoring and crop-cycle-based loans.
Cross-segment synergies: AI scoring and blockchain-led settlement reduce disputes, improve transparency, and shorten cash conversion cycles.
Geography Analysis
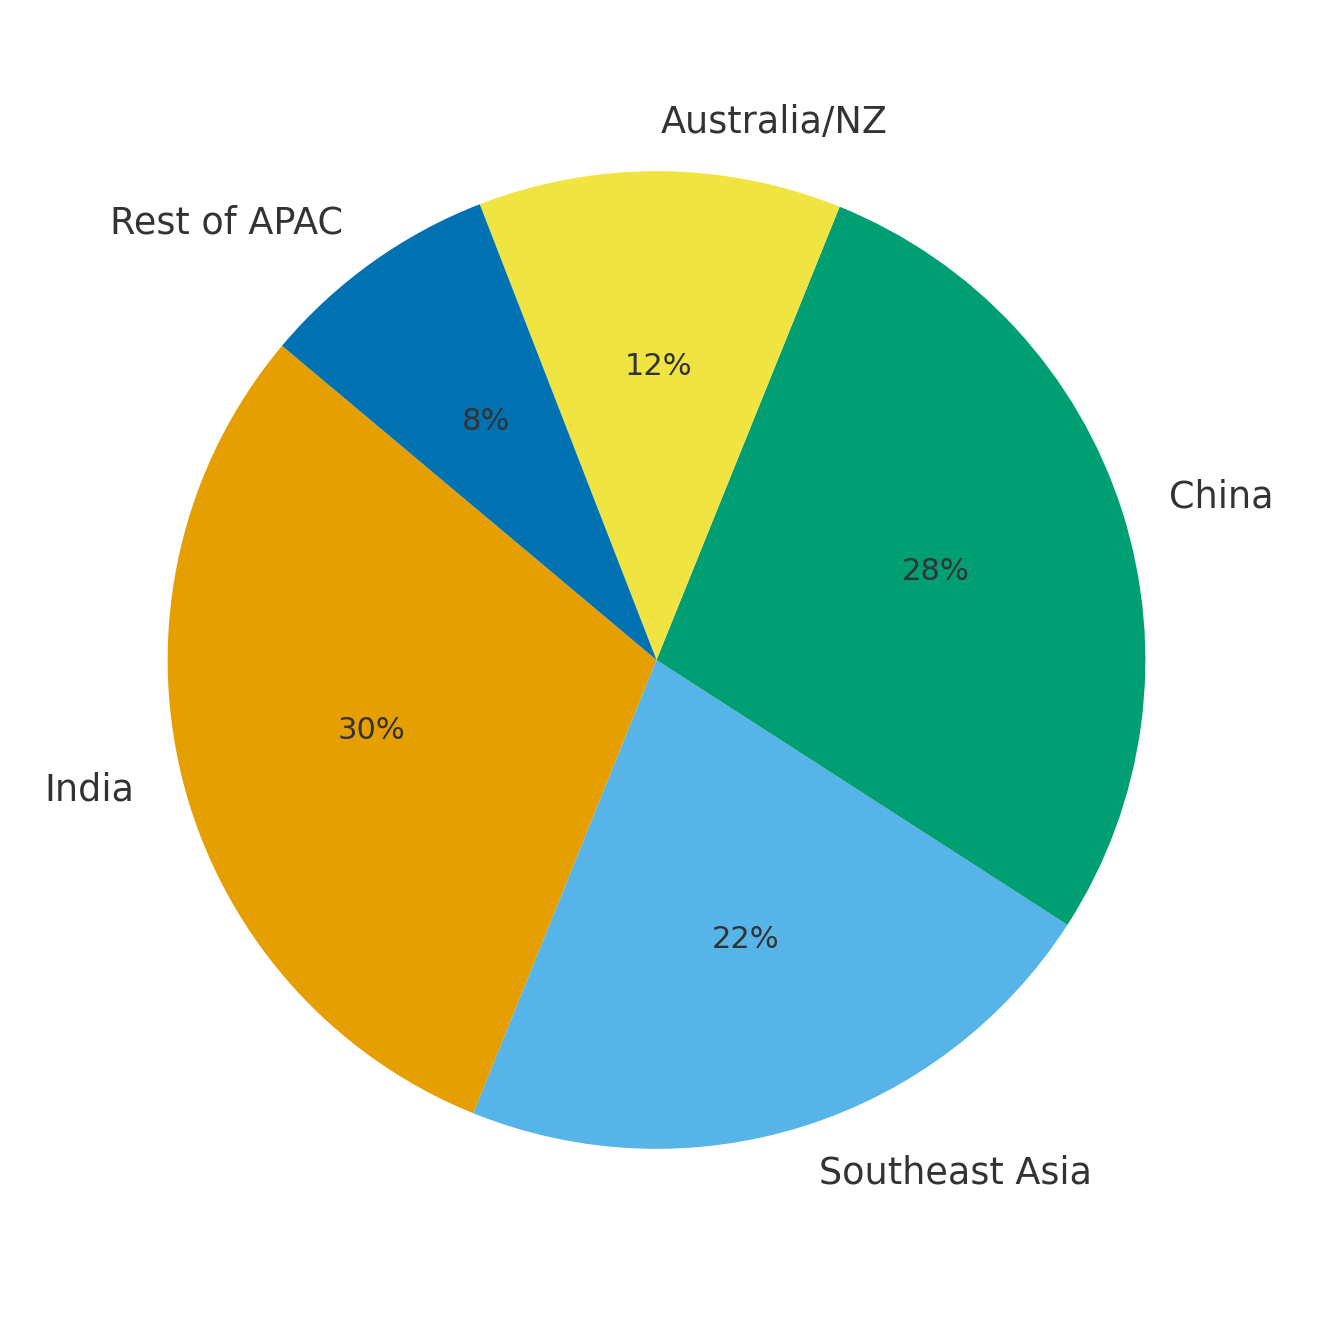
By 2030, India leads the APAC region with ~30% market share, followed by China (~28%), Southeast Asia (~22%), Australia/NZ (~12%), and the rest of APAC (~8%). India’s contribution is disproportionately high in platform-linked liquidity and SME inclusion. Southeast Asia’s growth comes from B2B trade networks in Indonesia, Vietnam, and Thailand, while China emphasizes AI-led export receivable analytics. Regional integration through frameworks like ASEAN Digital Gateway and Indo-Pacific Economic Corridors enhances multi-platform financing flows and risk visibility.
Competitive Landscape
The competitive landscape merges fintech, banks, and logistics ecosystems. Leading players include digital TReDS platforms, NBFCs offering API-linked invoice discounting, and embedded-finance providers. Partnerships between logistics tech firms, ERP vendors, and AI-credit networks define scalability. Key differentiators: (1) end-to-end data visibility across shipments and invoices; (2) risk-adjusted dynamic pricing; (3) ESG-compliant credit policies; and (4) regional interoperability. Expect consolidation as ecosystems evolve toward multi-rail financing combining bank, NBFC, and DeFi-originated liquidity.
Report Details
Proceed To Buy
Want a More Customized Experience?
- Request a Customized Transcript: Submit your own questions or specify changes. We’ll conduct a new call with the industry expert, covering both the original and your additional questions. You’ll receive an updated report for a small fee over the standard price.
- Request a Direct Call with the Expert: If you prefer a live conversation, we can facilitate a call between you and the expert. After the call, you’ll get the full recording, a verbatim transcript, and continued platform access to query the content and more.
68 Circular Road, #02-01 049422, Singapore
Revenue Tower, Scbd, Jakarta 12190, Indonesia
4th Floor, Pinnacle Business Park, Andheri East, Mumbai, 400093
Cinnabar Hills, Embassy Golf Links Business Park, Bengaluru, Karnataka 560071
Request Custom Transcript
Related Transcripts
$ 1450


68 Circular Road, #02-01 049422, Singapore
Revenue Tower, Scbd, No.52-53, Jakarta 12190, Indonesia
Cinnabar Hills, Embassy Golf Links Business Park, Bengaluru, Karnataka 560071
4th Floor, Pinnacle Business Park, Andheri East, Mumbai, 400093


68 Circular Road, #02-01 049422, Singapore
Revenue Tower, Scbd, Jakarta 12190, Indonesia
4th Floor, Pinnacle Business Park, Andheri East, Mumbai, 400093
Cinnabar Hills, Embassy Golf Links Business Park, Bengaluru, Karnataka 560071