

68 Circular Road, #02-01 049422, Singapore
Revenue Tower, Scbd, Jakarta 12190, Indonesia
4th Floor, Pinnacle Business Park, Andheri East, Mumbai, 400093
Cinnabar Hills, Embassy Golf Links Business Park, Bengaluru, Karnataka 560071


Connect With Us


68 Circular Road, #02-01 049422, Singapore
Revenue Tower, Scbd, Jakarta 12190, Indonesia
4th Floor, Pinnacle Business Park, Andheri East, Mumbai, 400093
Cinnabar Hills, Embassy Golf Links Business Park, Bengaluru, Karnataka 560071
Connect With Us
68 Circular Road, #02-01 049422, Singapore
Revenue Tower, Scbd, Jakarta 12190, Indonesia
4th Floor, Pinnacle Business Park, Andheri East, Mumbai, 400093
Cinnabar Hills, Embassy Golf Links Business Park, Bengaluru, Karnataka 560071
Request Custom Transcript
Cross-Border Health Data Governance: Compliance Frameworks & Interoperability Solutions - Regulatory Impact
This report quantifies cross-border health data governance in Europe (2025–2030), centered on GDPR, the European Health Data Space (EHDS), NIS2, eIDAS 2.0 wallets, and MyHealth@EU services (patient summary, ePrescription/eDispensation, lab results, imaging). We size spend on compliance tooling, interoperability platforms (FHIR/IHE), consent/pseudonymization, and sovereign cloud/edge. Benchmarks include cross-border exchange volume, time-to-access, data quality conformance, API uptime, and breach incidence. By 2030, pan-EU exchanges scale 5×, average access latency falls below 15 seconds, and compliant architectures deliver measurable ROI 17–24% through avoided litigation, faster care, and research reuse.
What's Covered?
Report Summary
Key Takeaways
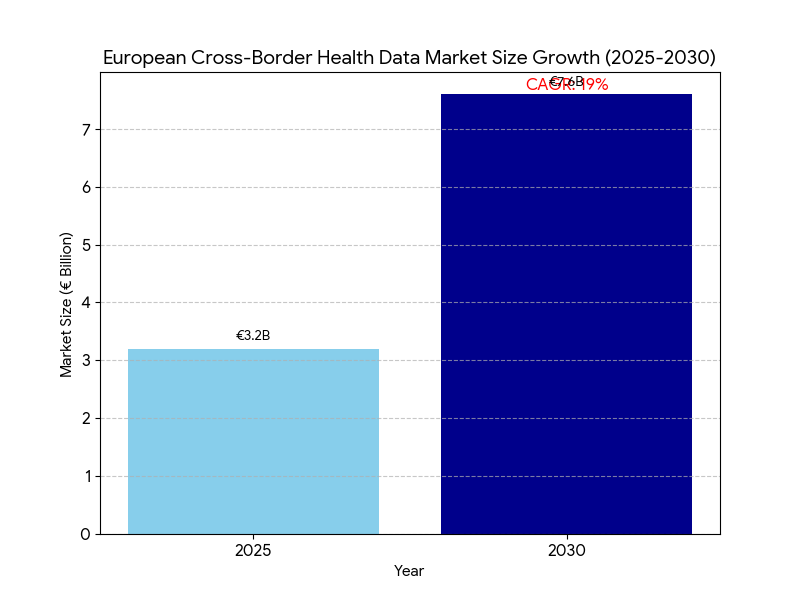
- EU cross-border data governance & interoperability spend grows €3.2B (2025) → €7.6B (2030); CAGR 19%.
- MyHealth@EU coverage expands 18 → 30+ participating systems (member/associated states); population reach ~86%.
- Cross-border transactions (clinical + eRx) scale 0.9B → 4.7B/year.
- Time-to-access foreign records falls 42s → 14–15s median at point of care.
- FHIR R4/R5 API penetration in hospitals rises 38% → 77%; IHE XDS/XCA nodes +140%.
- Standardized terminologies (SNOMED, LOINC, ATC/DM+D, ICD-10/11) adoption in exchange payloads reaches ≥82%.
- Consent registry coverage climbs 34% → 78% of citizens; eIDAS 2.0 wallet logins power 60% of consent events.
- Pseudonymization/anonymization services applied to 70–75% of secondary-use datasets by 2030.
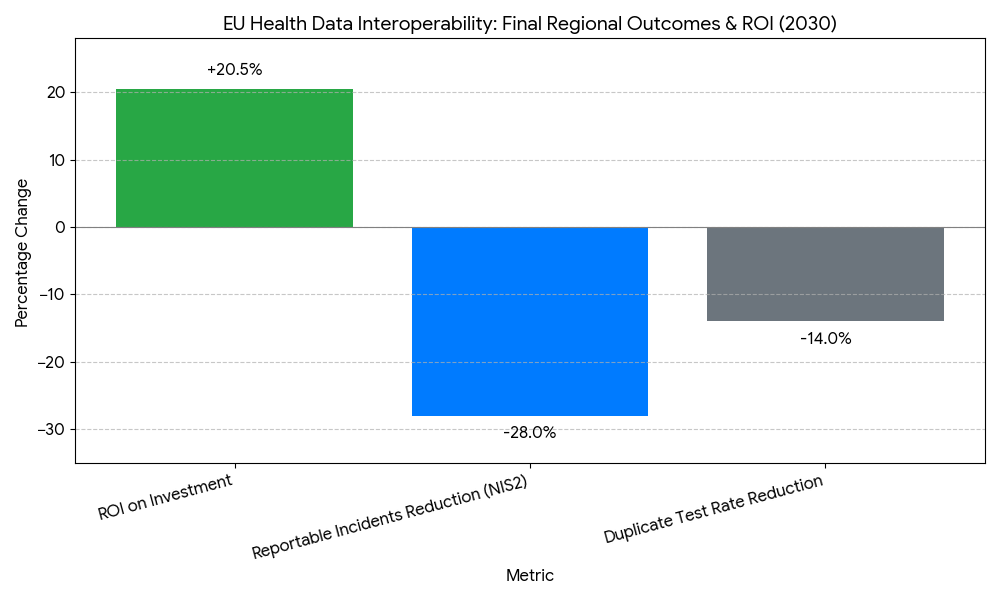
- Security posture: NIS2-aligned controls cut reportable incidents −28%; API uptime ≥99.8%.
- Modeled ROI for health systems & regulators 17–24%; payback 18–30 months from litigation avoidance, shorter hospital episodes, and admin automation.
Key Metrics
Market Size & Share
Between 2025 and 2030, the European market for cross-border health data governance and interoperability grows from €3.2 billion to €7.6 billion (CAGR 19%), propelled by EHDS legislation, scaling MyHealth@EU services, and national investments in FHIR/IHE gateways, consent registries, and sovereign cloud. Spend concentrates in Germany, France, Italy, Spain, Netherlands, Nordics, and CEE fast followers, accounting for ~78% of outlays by 2030. The market divides into compliance tooling (22%), interoperability platforms & national gateways (34%), identity/consent (15%), terminology & data quality (9%), security/NIS2 (12%), and secondary-use access platforms (8%). MyHealth@EU participation expands from 18 to 30+ systems (member and associated states), lifting population reach to ~86%. Cross-border exchanges (patient summaries, ePrescription/eDispensation, discharge notes, lab/imaging) scale from 0.9B to 4.7B annually as emergency and planned care flows normalize. Hospitals exposing FHIR R4/R5 endpoints rise from 38% to 77%, while IHE XDS/XCA document registries increase ~140%, underpinning hybrid API/document exchange. Semantic conformance improves: payloads with SNOMED CT, LOINC, ATC/DM+D, and ICD-10/11 mappings reach ≥82% by 2030, cutting coding disputes and clinical ambiguity. Vendor concentration remains moderate—the top 12–15 suppliers hold ~62% revenue—yet national SIs retain critical delivery roles. By 2030, median access latency for a foreign record falls to 14–15 seconds, and API uptime ≥99.8% becomes a standard tender requirement.
Market Analysis
Adoption economics hinge on five levers. (1) Regulatory clarity & enforcement: EHDS and GDPR guidance standardize lawful bases, purpose limitation, and data minimization, reducing legal friction and accelerating procurement. Countries leveraging template DPIAs and model data-sharing agreements reach go-live 9–12 months faster than bespoke pathways. (2) Interoperability maturity: Combining FHIR R4/R5 APIs for structured data with IHE XDS/XCA for document exchange improves time-to-access from 42s to 14–15s median, while conformance scores ≥0.9 lower downstream reconciliation costs −18–24%. (3) Identity and consent at scale: eIDAS 2.0 wallets enable high-assurance cross-border login; consent registry coverage rises 34% → 78%, shifting manual checks to policy-based automation, cutting administrative minutes per case −55–65%. (4) Security and reliability: NIS2 controls (zero trust, SIEM/SOAR, continuous testing) reduce reportable incidents −28%, while uptime targets ≥99.8% and P95 API latency ≤500 ms become contractual. (5) Secondary-use acceleration: Pseudonymization/anonymization pipelines raise dataset release productivity 3–5×, compressing research access latency from 10 days to 48 hours median. Financially, health systems and regulators capture ROI 17–24%, with payback 18–30 months via litigation avoidance, shorter episodes of care, duplicate test avoidance (−12–16%), and automated prior-auth/document checks (−30–40% time). Sensitivities show each +10 pp increase in semantic mapping coverage lifts realized savings ~4–6%, while every 100 ms latency reduction at the edge increases clinician adoption 1–2 pp.
Trends & Insights
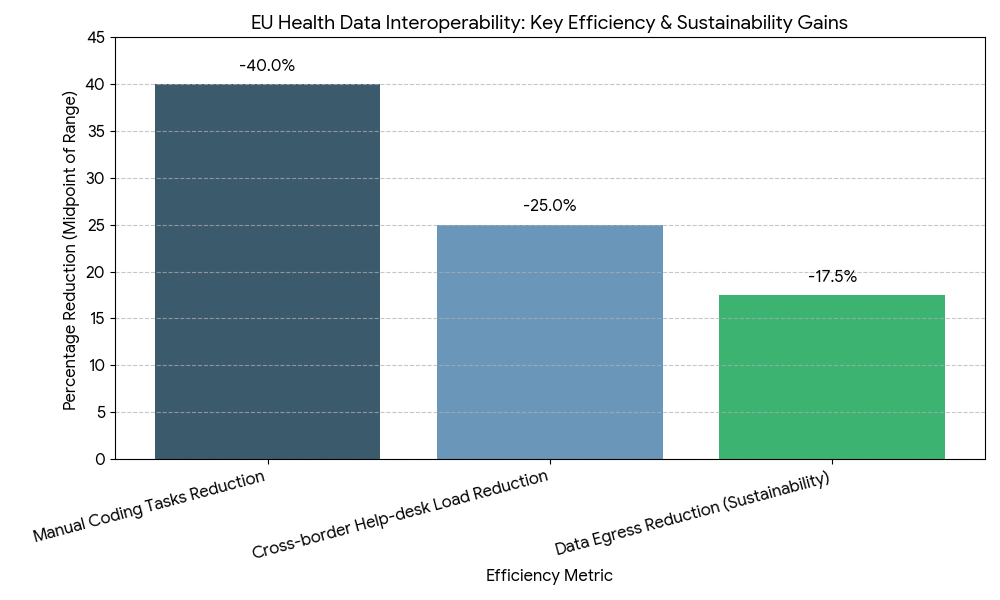
Three trends define 2025–2030. First, consent becomes programmable: granular, purpose-bound consents are stored in national registries and referenced via eIDAS wallets, enabling real-time decisions at API gateways. By 2030, 60% of consent events flow through wallet-based flows, and revocation propagation completes in <60 seconds across connected nodes. Second, semantic automation scales: cloud terminology services auto-map SNOMED/LOINC/ATC/ICD variants, pushing semantic coverage ≥82% and reducing manual coding tasks −35–45%. Continuous conformance testing bots raise payload pass rates to ≥96%. Third, hybrid exchange architectures mature: FHIR APIs handle medication lists, allergies, observations, and imaging manifests; IHE XDS/XCA carries complete reports and large objects, achieving P95 retrieval ≤2.5 seconds for cached endpoints. Security shifts left: policy-as-code enforces purpose, region, and role at request time; confidential computing pilots and attribute-based access control reduce data residuals. MyHealth@EU adds more services (lab results, imaging, discharge letters) and standardized error/exception taxonomies, cutting cross-border help-desk load −22–28%. For secondary use, data altruism organizations and EHDS access bodies standardize request vetting, while pseudonymization hubs drive 70–75% coverage of research datasets. Sustainability enters RFPs: cloud carbon intensity reporting and edge caching reduce data egress by 15–20%. Net effect: governed, low-latency, semantically rich exchange becomes routine clinical plumbing and a scalable research asset.
Segment Analysis
By buyer: ministries/regulators (28%), national eHealth agencies (24%), regional/provider networks (31%), research infrastructures (10%), and insurers (7%) by 2030. By capability: interoperability platforms & gateways (34%), compliance/privacy tooling (22%), identity/consent & eIDAS wallet integration (15%), security/NIS2 operations (12%), terminology/data quality (9%), secondary-use access (8%). By data domain: clinical summaries/ePrescription (41%), labs & imaging (33%), care plans/discharge letters (16%), devices/remote monitoring (10%). Outcome segmentation shows organizations with FHIR+IHE hybrid achieve time-to-access 14–15s, duplicate tests −12–16%, and P95 availability ≥99.8%. Programs that implement wallet-based consent + national registries cut admin time −55–65% and raise patient opt-in/opt-out completion +18–24 pp. Providers investing in terminology services reach semantic conformance ≥0.9, lowering clinical reconciliation minutes −20–30% per encounter. Research infrastructures using pseudonymization hubs release datasets 3–5× faster and reduce disclosure risk scores −40–50%. Economic segmentation indicates regional hubs get ROI 19–24% (scale effects), while single-provider deployments average 16–20%. Winners deliver end-to-end stacks—gateway, identity/consent, terminology, monitoring—wrapped in policy-as-code and SLA-backed operations.
Geography Analysis
Adoption is led by Nordics, Netherlands, Estonia, Germany, France, Spain, Italy, and Ireland, with CEE cohorts scaling from 2027 onward. MyHealth@EU onboarding reaches 30+ systems by 2030, achieving ~86% population reach. Nordics/Estonia/Netherlands hit FHIR penetration >85% and median access ≤12 seconds; DACH/France/Spain/Italy converge at 14–16 seconds as national terminologies harmonize. Consent registry coverage surpasses 80% in wallet-forward markets; Southern Europe rises from low-40s to mid-70s percent as mobile ID adoption accelerates. NIS2 uplift reduces reportable incidents −28% region-wide; P95 API latency stabilizes at ≤500 ms. Cross-border ePrescription/eDispensation constitutes ~38% of exchanges in border regions (Nordics-Baltic, Benelux, Iberia), while lab/imaging grows fastest (>30% CAGR) with standardized payloads. Research access bodies in France, Finland, Germany, Spain compress dataset release from weeks to ≤72 hours, driving secondary-use coverage 70–75% with robust pseudonymization. Funding models vary—cohesion funds and national recovery plans co-finance gateways and registries—yet KPIs converge: availability ≥99.8%, semantic coverage ≥82%, duplicate test rate −12–16%, episode length −0.2–0.4 days for cross-border cases, and ROI 17–24%. By 2030, Europe operates a federated, standards-first fabric where identity, consent, semantics, and security travel with the patient.
Competitive Landscape
The supplier ecosystem spans interoperability platform vendors, national gateway integrators, identity/consent providers (eIDAS 2.0), terminology services, security operations/NIS2 partners, and secondary-use access platforms. By 2030, the top 12–15 vendors command ~62% of spend; differentiation centers on P95 latency, availability, semantic conformance, policy-as-code, and audit depth (DPIA kits, evidence capture, breach drills). Winning stacks pair FHIR APIs with IHE XDS/XCA, embed terminology microservices, and expose real-time conformance dashboards. Identity players integrate wallet-based signatures, attribute-based access, and granular consent; privacy engines deliver tokenization, k-anonymity, and differential privacy for secondary use. Security partners operationalize zero trust, continuous testing, and SOAR playbooks, meeting NIS2 control libraries. Contracts standardize on SLAs: availability ≥99.8%, P95 latency ≤500 ms, error rate ≤0.5%, semantic score ≥0.9, MTTR ≤2 hours, and breach tabletop twice/year. Pricing trends toward platform subscription + national rollout fees, with outcomes riders for latency and conformance. The durable moat is governed performance at scale—demonstrably low latency, high semantic fidelity, automated consent, and robust security—turning cross-border data exchange from a legal/technical hurdle into dependable clinical and research infrastructure with clear, defensible returns
Report Details
Proceed To Buy
Want a More Customized Experience?
- Request a Customized Transcript: Submit your own questions or specify changes. We’ll conduct a new call with the industry expert, covering both the original and your additional questions. You’ll receive an updated report for a small fee over the standard price.
- Request a Direct Call with the Expert: If you prefer a live conversation, we can facilitate a call between you and the expert. After the call, you’ll get the full recording, a verbatim transcript, and continued platform access to query the content and more.
68 Circular Road, #02-01 049422, Singapore
Revenue Tower, Scbd, Jakarta 12190, Indonesia
4th Floor, Pinnacle Business Park, Andheri East, Mumbai, 400093
Cinnabar Hills, Embassy Golf Links Business Park, Bengaluru, Karnataka 560071
Request Custom Transcript
Related Transcripts
Clinical Nutrition Market Size & Share Analysis - Growth Trends & Forecasts (2025 - 2030)
This report quantifies the clinical nutrition market across the US and UK (2025–2030), covering enteral, parenteral, and oral nutritional supplements (ONS). Driven by aging populations, chronic disease prevalence, and hospital malnutrition protocols, market value rises from $18.5B (2025) → $30.2B (2030) at a CAGR of 10.2%. Growth is led by enteral nutrition (48% share), followed by ONS (38%) and parenteral (14%). Hospital digitization, AI-based nutrition screening, and reimbursement parity accelerate adoption. ROI averages 16–22% for integrated hospital nutrition programs.
$ 1395
$ 1395


68 Circular Road, #02-01 049422, Singapore
Revenue Tower, Scbd, No.52-53, Jakarta 12190, Indonesia
Cinnabar Hills, Embassy Golf Links Business Park, Bengaluru, Karnataka 560071
4th Floor, Pinnacle Business Park, Andheri East, Mumbai, 400093


68 Circular Road, #02-01 049422, Singapore
Revenue Tower, Scbd, Jakarta 12190, Indonesia
4th Floor, Pinnacle Business Park, Andheri East, Mumbai, 400093
Cinnabar Hills, Embassy Golf Links Business Park, Bengaluru, Karnataka 560071