

68 Circular Road, #02-01 049422, Singapore
Revenue Tower, Scbd, Jakarta 12190, Indonesia
4th Floor, Pinnacle Business Park, Andheri East, Mumbai, 400093
Cinnabar Hills, Embassy Golf Links Business Park, Bengaluru, Karnataka 560071


Connect With Us


68 Circular Road, #02-01 049422, Singapore
Revenue Tower, Scbd, Jakarta 12190, Indonesia
4th Floor, Pinnacle Business Park, Andheri East, Mumbai, 400093
Cinnabar Hills, Embassy Golf Links Business Park, Bengaluru, Karnataka 560071
Connect With Us
68 Circular Road, #02-01 049422, Singapore
Revenue Tower, Scbd, Jakarta 12190, Indonesia
4th Floor, Pinnacle Business Park, Andheri East, Mumbai, 400093
Cinnabar Hills, Embassy Golf Links Business Park, Bengaluru, Karnataka 560071
Request Custom Transcript
Cold Chain Automation: Robotics in Perishable Logistics & Energy Efficiency Benchmarks
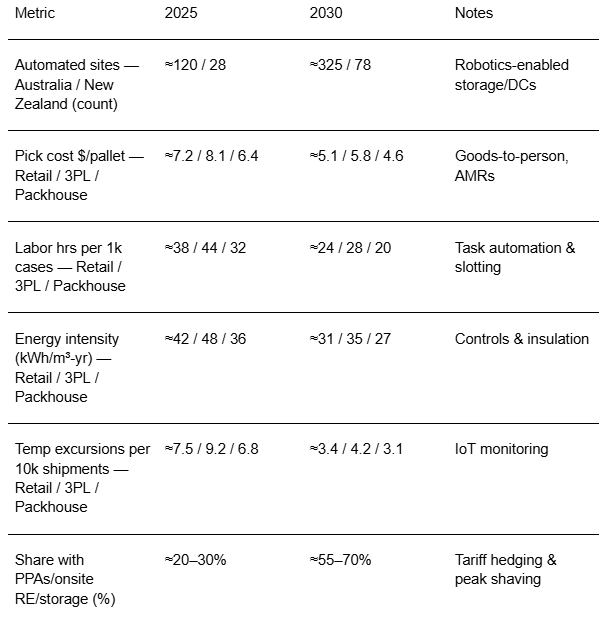
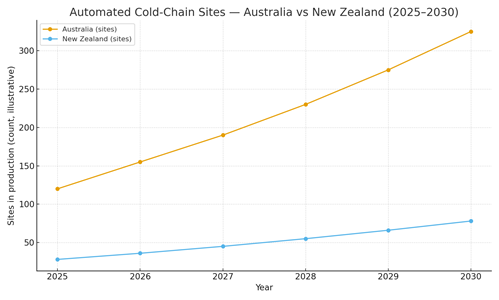
Between 2025 and 2030, ANZ cold chains pivot from labor‑intensive operations to robotics‑enabled, energy‑tuned facilities. Australia leads in automated aisle systems (shuttles/cranes/AS/RS), mobile robotics for case/pallet movement, and computer‑vision QA at dock doors; New Zealand scales compact multi‑client nodes tied to export corridors. The winning blueprint integrates automation with energy engineering: variable‑speed drives, high‑efficiency compressors, floating head pressure, heat recovery, and thermal storage to flatten peaks. Data contracts unify WMS, SCADA, and BMS so robots and refrigeration setpoints react to demand, tariffs, and weather. Illustratively, automated cold‑chain sites in Australia grow from ~120 in 2025 to ~325 by 2030; New Zealand from ~28 to ~78.
What's Covered?
Report Summary
Key Takeaways
1. Pair automation with energy engineering controls and tariffs drive as much ROI as robots.
2. Start with high-throughput, repetitive flows (layer picking, shuttle aisles) before bespoke automation.
3. Retrofit roadmap: insulation, doors, VSDs, and controls first; heavy mechatronics second.
4. Use PPAs/on-site solar+batteries and thermal storage to hedge tariffs and flatten peaks.
5. Computer vision at docks reduces misloads and excursion risk; integrate with WMS exceptions.
6. Design for food safety: digital HACCP/GMP logs and automated validation of setpoints.
7. Workforce transition: upskill pickers to robot supervisors and maintenance techs.
8. Outcome contracts indexed to pick $/pallet, kWh/m³-yr, and excursion rates align incentives.
Key Metrics
Market Size & Share
Automation footprints in ANZ scale with retail consolidation, export demand, and tariff volatility. In this illustrative outlook, automated cold-chain sites in Australia expand from ~120 in 2025 to ~325 by 2030, while New Zealand rises from ~28 to ~78. Share concentrates in metro-adjacent hubs (NSW/VIC/QLD) where labor constraints and land costs justify dense vertical storage and goods-to-person systems. Regional nodes grow via packhouses and 3PL multi-client facilities supporting produce and proteins.
By 2030, leaders bundle robotics with energy orchestration tying WMS to controls and tariffs to maintain service levels during peaks while cutting kWh/m³-yr. Vendors with proven references, retrofit playbooks, and integration depth capture a disproportionate share of wallet.
Market Analysis
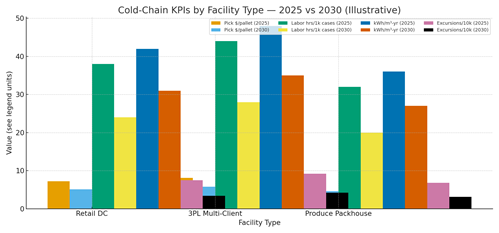
Unit economics improve as automation density and controls mature. In this outlook, pick cost per pallet falls ~25–35% with shuttle AS/RS and AMRs; labor hours per 1k cases drop ~30–45% as repetitive moves are automated; energy intensity declines ~20–30% through VSDs, floating head pressure, and insulation upgrades; and temperature excursions halve with continuous monitoring and dock-door vision. Cost stack: mechatronics, controls/IT, retrofit envelope, and downtime. Value stack: labor savings, energy hedging, fewer excursions/claims, higher throughput, and resilience during tariff spikes.
Risks: over-automation, integration complexity, tariff unpredictability, and skills gaps. Mitigations: staged deployments, digital twins for throughput/energy tests, PPAs/batteries/thermal storage, and upskilling programs for maintenance and supervision. Finance will expect monthly dashboards with pick $/pallet, kWh/m³-yr, excursions/10k, and SLA adherence.
Trends & Insights (2025–2030)
• Shuttle AS/RS and AMRs dominate greenfields; retrofits emphasize VSDs, controls, and selective robotics.
• Computer vision at docks and along conveyors detects misloads, packaging damage, and condensation risks.
• Tariff-aware scheduling shifts defrost, charging, and peak picks to off-peak windows.
• Thermal storage and heat recovery integrate with refrigeration for demand management and hot-water loads.
• Digital HACCP/GMP records with IoT sensors standardize audits and incident response.
• Labor transitions to mechatronics, controls, and QA roles; micro-credentials validate skills.
• Outcome-based contracts link vendor fees to pick $/pallet, kWh/m³-yr, and excursion rates.
• 3PL multi-client nodes gain share by amortizing automation across seasonal clients.
Segment Analysis (Facility Types)
• Retail DCs: highest SKU complexity; benefit from goods-to-person, shuttle aisles, and layer picking. Energy orchestration aligns with promotional peaks.
• 3PL Multi-Client: flexible slotting and AMRs accommodate seasonality; energy and service SLAs become differentiators for brand clients.
• Produce Packhouses: conveyors, robotic palletizers, and rapid-chill zones; excursion risk managed via dock vision and inline sensing.
Buyer guidance: baseline KPIs, map automation to SKU and temperature zones, deploy energy controls early, and structure outcome contracts on operational and energy metrics.
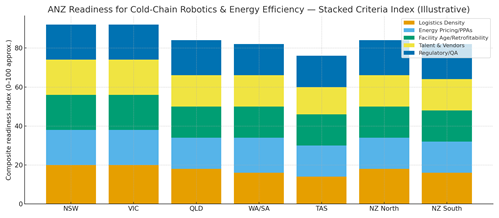
Geography Analysis (ANZ)
Readiness clusters in NSW and VIC with dense logistics and vendor presence; QLD expands with produce and protein export corridors; WA/SA favor energy projects and greenfield sites; TAS and NZ emphasize quality and export reliability. The stacked criteria—logistics density, energy pricing/PPAs, facility age/retrofitability, talent & vendors, and regulatory/QA indicate where production SLAs can be met first for robotics and energy efficiency.
Implications: stage deployments in high-readiness states; lock PPAs and storage for tariff hedging; sequence retrofits (envelope, controls, mechatronics); and publish audit-ready energy and QA dashboards.
Competitive Landscape (Vendors & Operating Models)
Stacks converge on: (i) mechatronics (shuttle AS/RS, AMRs, palletizers); (ii) controls/IT (WMS, SCADA, BMS integration); (iii) energy (VSDs, controls, storage, PPAs); (iv) QA/safety (HACCP/GMP, vision); and (v) analytics/SLAs. Differentiators: retrofit playbooks, throughput at low temps, integration quality, energy orchestration, and auditability. System integrators bundle design, installation, and commissioning; operators retain control planes and outcome-based contracts. Contracts trend toward fees indexed to operational and energy KPIs with shared-savings models, underpinned by verified QA and energy dashboards.
Report Details
Proceed To Buy
Want a More Customized Experience?
- Request a Customized Transcript: Submit your own questions or specify changes. We’ll conduct a new call with the industry expert, covering both the original and your additional questions. You’ll receive an updated report for a small fee over the standard price.
- Request a Direct Call with the Expert: If you prefer a live conversation, we can facilitate a call between you and the expert. After the call, you’ll get the full recording, a verbatim transcript, and continued platform access to query the content and more.
68 Circular Road, #02-01 049422, Singapore
Revenue Tower, Scbd, Jakarta 12190, Indonesia
4th Floor, Pinnacle Business Park, Andheri East, Mumbai, 400093
Cinnabar Hills, Embassy Golf Links Business Park, Bengaluru, Karnataka 560071
Request Custom Transcript
Related Transcripts

$ 1395


68 Circular Road, #02-01 049422, Singapore
Revenue Tower, Scbd, No.52-53, Jakarta 12190, Indonesia
Cinnabar Hills, Embassy Golf Links Business Park, Bengaluru, Karnataka 560071
4th Floor, Pinnacle Business Park, Andheri East, Mumbai, 400093


68 Circular Road, #02-01 049422, Singapore
Revenue Tower, Scbd, Jakarta 12190, Indonesia
4th Floor, Pinnacle Business Park, Andheri East, Mumbai, 400093
Cinnabar Hills, Embassy Golf Links Business Park, Bengaluru, Karnataka 560071