

68 Circular Road, #02-01 049422, Singapore
Revenue Tower, Scbd, Jakarta 12190, Indonesia
4th Floor, Pinnacle Business Park, Andheri East, Mumbai, 400093
Cinnabar Hills, Embassy Golf Links Business Park, Bengaluru, Karnataka 560071


Connect With Us


68 Circular Road, #02-01 049422, Singapore
Revenue Tower, Scbd, Jakarta 12190, Indonesia
4th Floor, Pinnacle Business Park, Andheri East, Mumbai, 400093
Cinnabar Hills, Embassy Golf Links Business Park, Bengaluru, Karnataka 560071
Connect With Us
68 Circular Road, #02-01 049422, Singapore
Revenue Tower, Scbd, Jakarta 12190, Indonesia
4th Floor, Pinnacle Business Park, Andheri East, Mumbai, 400093
Cinnabar Hills, Embassy Golf Links Business Park, Bengaluru, Karnataka 560071
Request Custom Transcript
5G Edge in UK Smart Mobility: Network Infrastructure, Urban Use Cases & Revenue Models (2025–2030)
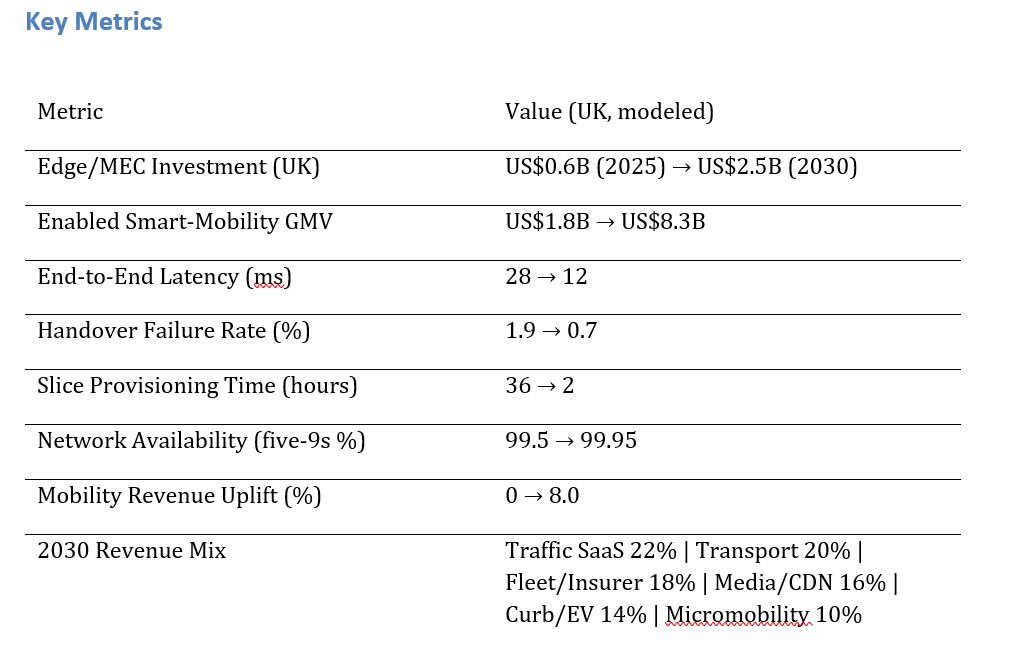
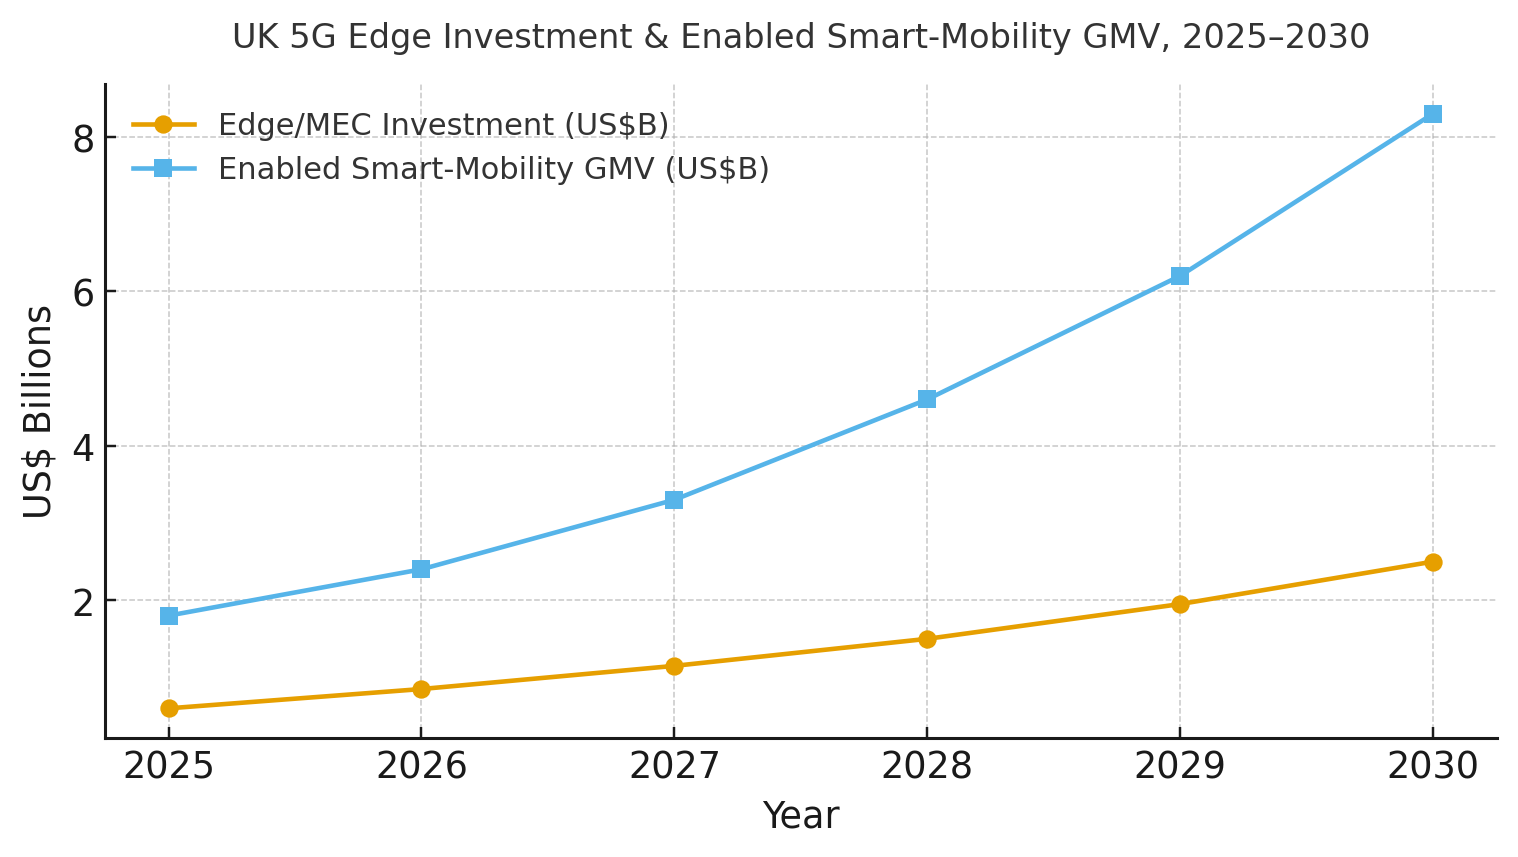
UK operators are investing in a low-latency foundation for smart mobility, distributing compute to metro edge sites and peering with CDNs. Between 2025 and 2030, edge/MEC investment is expected to rise from ~$0.6B to ~$2.5B, while the GMV from edge-dependent mobility services grows from ~$1.8B to ~$8.3B. The operational impact includes reduced latency, improved handover rates, and faster slice provisioning, unlocking revenue through municipal SaaS fees, safety products, and media services. Pricing strategies include value-based SLAs and tiered API plans. By 2030, UK 5G edge will drive repeatable mobility revenue, benefiting both operators and commuters.
What's Covered?
Report Summary
Key Takeaways
1. Latency, handover, and availability are the pillars of mobility‑grade SLAs.
2. Edge clusters must be multi‑tenant to reach target utilization and IRR.
3. Expose network features (slicing, QoS, location) via APIs with clear pricing.
4. Start with city corridors (signals, CCTV, bus lanes) to prove value fast.
5. Bundle CDN/media for in‑vehicle screens to monetize low‑latency paths.
6. Partner with OEMs, fleets, and councils; align on data‑sharing policies.
7. Automate slice provisioning and failover to meet event surges reliably.
8. CFO dashboard: latency ms, handover %, provisioning hrs, availability %, revenue uplift %, IRR.
a. Market Size & Share
UK edge/MEC spend is modeled to rise from ~US$0.6B in 2025 to ~US$2.5B in 2030, while edge‑dependent smart‑mobility GMV expands from ~US$1.8B to ~US$8.3B. Share accrues to operators with dense metro pops, fiber depth, and partnerships with city councils, transport authorities, and OEMs. The line figure charts investment and enabled GMV.
Stack share: network cloud and edge sites; exposure APIs; application platforms (traffic, transport, fleet, media); and analytics/security. Execution risks include underutilized edge clusters and integration debt; mitigations: corridor‑first rollouts, multi‑tenant placement, and ISV marketplaces. Share should be tracked via revenue by use case, utilization %, SLA attainment, and developer/API adoption.
b. Market Analysis
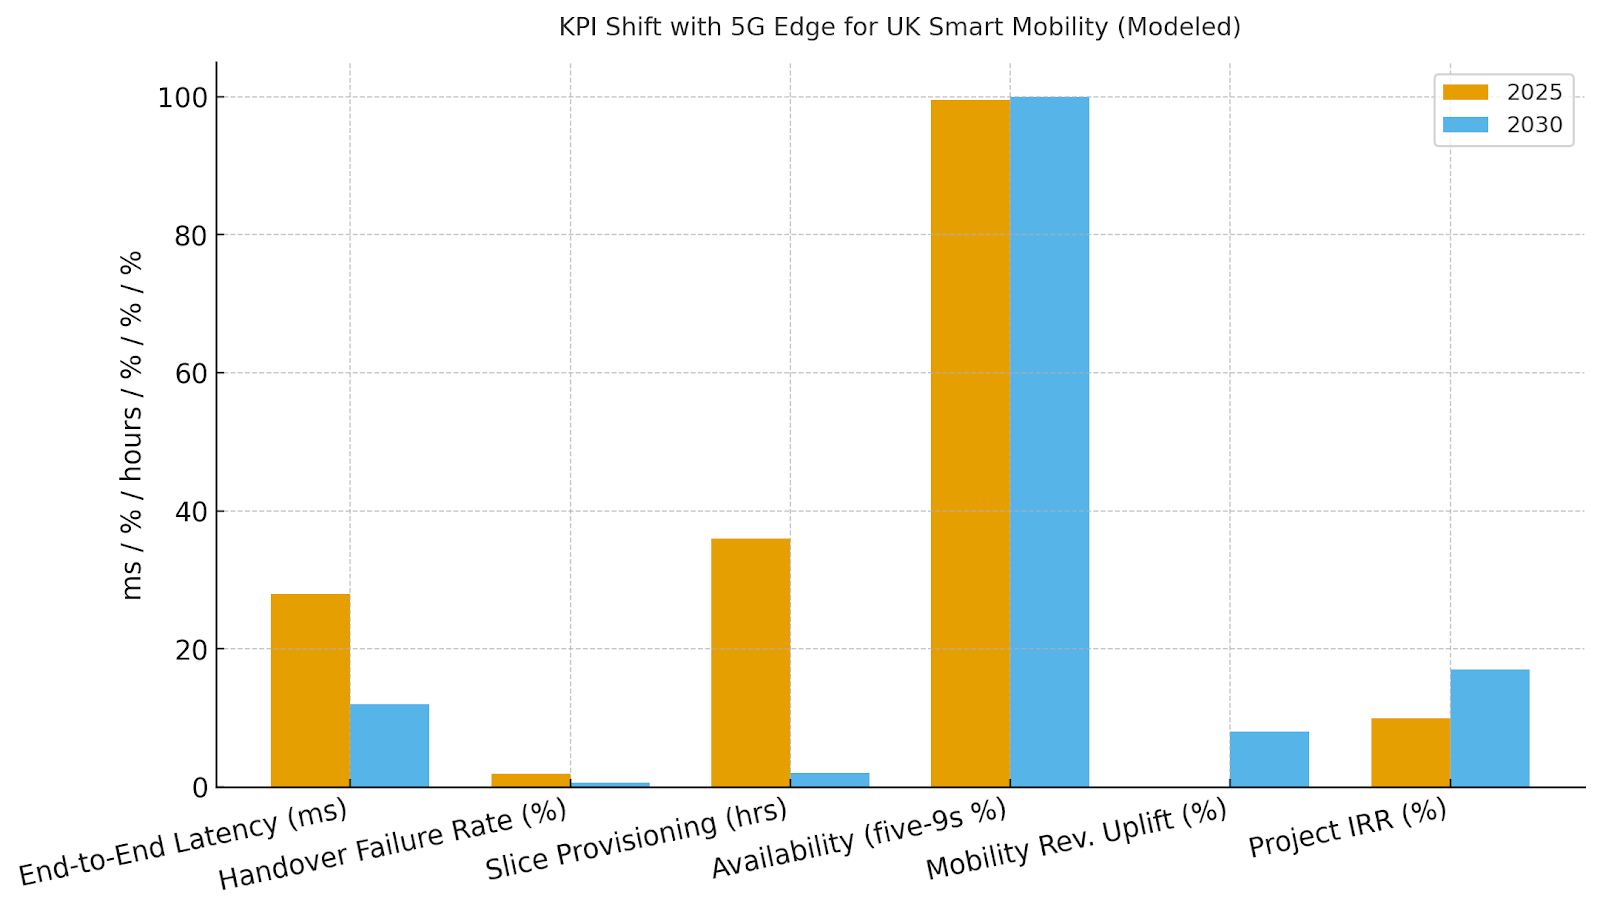
Mobility‑grade performance converts into priceable SLAs and new revenue lines. We model latency dropping from ~28ms to ~12ms, handover failure from ~1.9% to ~0.7%, slice provisioning from ~36 to ~2 hours, availability to ~99.95%, mobility revenue uplift to ~8%, and IRR to ~17% by 2030. Enablers: metro edge clusters, Xn/N2 handover tuning, CI/CD for network apps, and exposure APIs. Barriers: capex phasing, rights‑of‑way, and fragmented procurement across councils and agencies.
Financial lens: attribute revenue from SaaS to councils, fleet/insurer safety, media/CDN, and curb/EV platforms; net against edge capex/opex and integration. The bar chart summarizes directional KPI shifts under disciplined edge strategies.
c) Trends & Insights
1) Corridor‑first deployments (signals, CCTV, bus lanes) prove value quickly. 2) Network exposure APIs enable developer ecosystems for mobility. 3) Edge‑native media/CDN for in‑vehicle screens becomes a monetization lever. 4) Digital twins and event simulation improve signal timing and safety. 5) Open data and privacy‑preserving analytics unlock council tenders. 6) Hybrid sat‑edge backhaul adds resilience for rural routes. 7) Integrated curb, parking, and EV charging platforms monetize kerbside. 8) SLO‑driven FinOps governs utilization and spend. 9) Safety analytics for micromobility reduce accidents and liability. 10) SLA‑backed slices for emergency services and rail operations gain traction.
d) Segment Analysis
Cities & Councils: traffic management SaaS, incident response, air‑quality insights; price per intersection/corridor. Transport Operators: live telemetry, headway optimization, station analytics; price per vehicle/route. Fleets & Insurers: V2X safety, ADAS offload, video evidence; price per vehicle/GB. OEMs & Media: in‑vehicle CDN, gaming latency passes; rev‑share per screen. Curb & EV: dynamic pricing, availability, and payment APIs. Micromobility: geofencing, safety analytics, and charging. Track latency, handover, utilization, SLA attainment, revenue per asset, and IRR by segment.
e) Geography Analysis
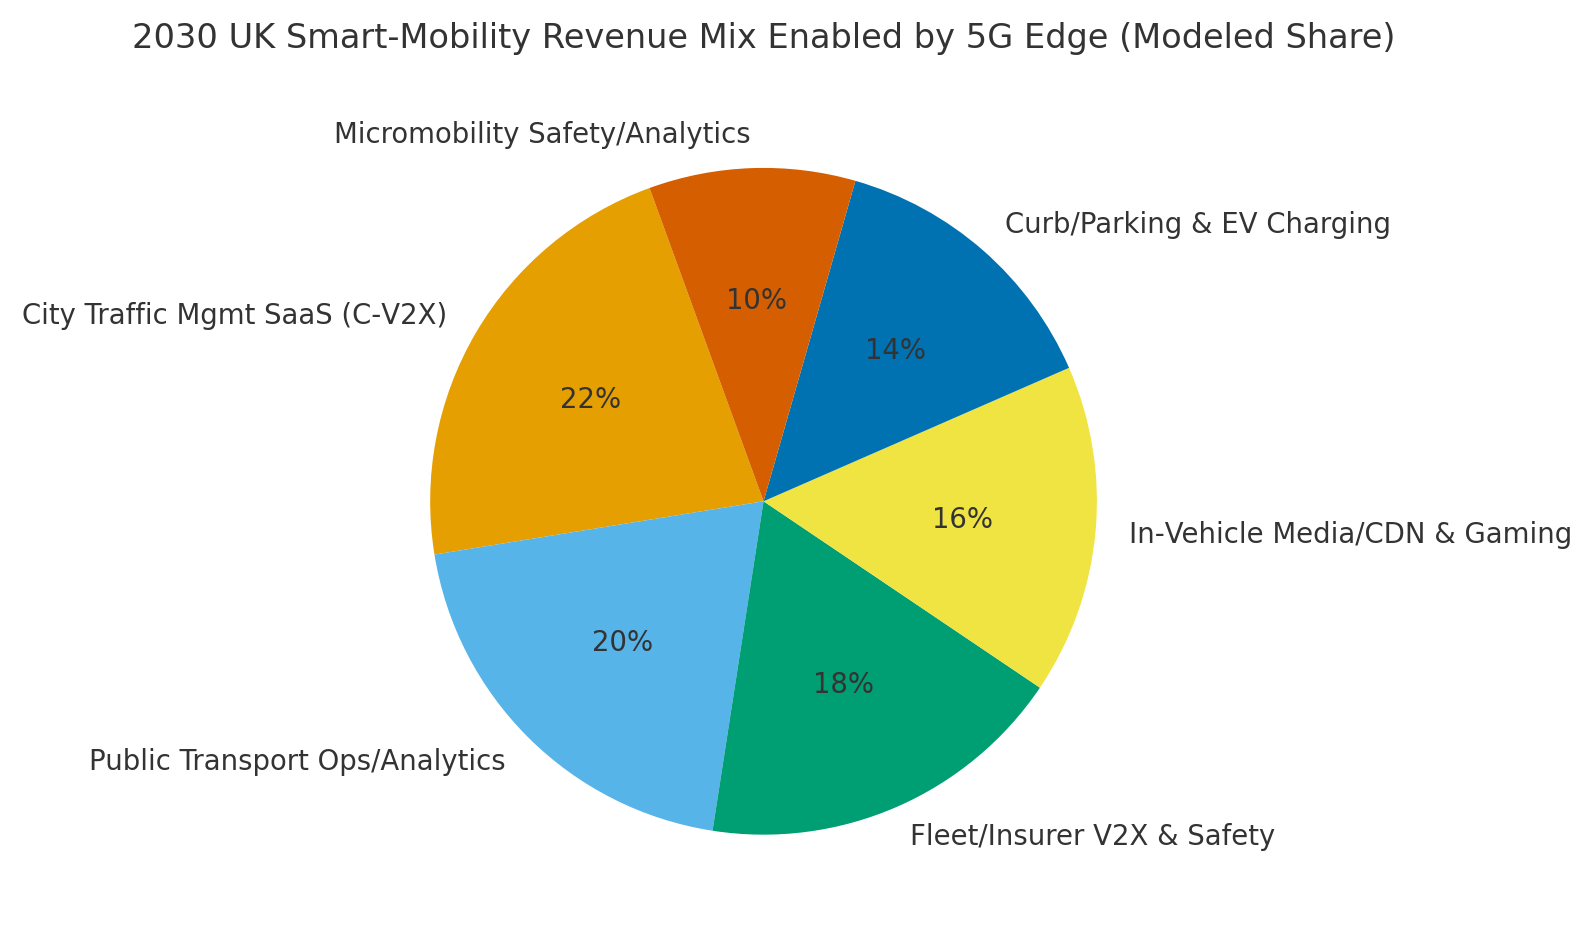
By 2030, we model UK smart‑mobility revenue from 5G edge as Traffic Mgmt SaaS (~22%), Public Transport Ops/Analytics (~20%), Fleet/Insurer V2X & Safety (~18%), In‑Vehicle Media/CDN & Gaming (~16%), Curb/Parking & EV Charging (~14%), and Micromobility Safety/Analytics (~10%). London leads early through density and budget; West Midlands and Manchester follow due to transport programs and testbeds. The pie figure illustrates the revenue mix.
Execution: align with regional authorities; phase corridors near fiber and transit hubs; and publish API marketplaces for local ISVs. Measure region‑specific utilization, SLA attainment, revenue per corridor, and developer adoption; reallocate capex quarterly.
f) Competitive Landscape
Incumbent MNOs, neutral‑host providers, hyperscalers, and mobility ISVs compete to anchor UK edge corridors. Differentiation vectors: (1) metro edge footprint and latency, (2) handover performance at junctions/tunnels, (3) API productization and developer support, (4) resilience and data‑residency for public sector, and (5) ISV ecosystems. Procurement guidance: require SLA‑backed latency, open APIs, observability, and revenue‑share structures with OEMs and operators. Competitive KPIs: latency, handover %, availability, slice provisioning time, utilization %, revenue growth, and IRR.
Report Details
Proceed To Buy
Want a More Customized Experience?
- Request a Customized Transcript: Submit your own questions or specify changes. We’ll conduct a new call with the industry expert, covering both the original and your additional questions. You’ll receive an updated report for a small fee over the standard price.
- Request a Direct Call with the Expert: If you prefer a live conversation, we can facilitate a call between you and the expert. After the call, you’ll get the full recording, a verbatim transcript, and continued platform access to query the content and more.
68 Circular Road, #02-01 049422, Singapore
Revenue Tower, Scbd, Jakarta 12190, Indonesia
4th Floor, Pinnacle Business Park, Andheri East, Mumbai, 400093
Cinnabar Hills, Embassy Golf Links Business Park, Bengaluru, Karnataka 560071
Request Custom Transcript
Related Transcripts


68 Circular Road, #02-01 049422, Singapore
Revenue Tower, Scbd, No.52-53, Jakarta 12190, Indonesia
Cinnabar Hills, Embassy Golf Links Business Park, Bengaluru, Karnataka 560071
4th Floor, Pinnacle Business Park, Andheri East, Mumbai, 400093


68 Circular Road, #02-01 049422, Singapore
Revenue Tower, Scbd, Jakarta 12190, Indonesia
4th Floor, Pinnacle Business Park, Andheri East, Mumbai, 400093
Cinnabar Hills, Embassy Golf Links Business Park, Bengaluru, Karnataka 560071