

68 Circular Road, #02-01 049422, Singapore
Revenue Tower, Scbd, Jakarta 12190, Indonesia
4th Floor, Pinnacle Business Park, Andheri East, Mumbai, 400093
Cinnabar Hills, Embassy Golf Links Business Park, Bengaluru, Karnataka 560071


Connect With Us


68 Circular Road, #02-01 049422, Singapore
Revenue Tower, Scbd, Jakarta 12190, Indonesia
4th Floor, Pinnacle Business Park, Andheri East, Mumbai, 400093
Cinnabar Hills, Embassy Golf Links Business Park, Bengaluru, Karnataka 560071
Connect With Us
68 Circular Road, #02-01 049422, Singapore
Revenue Tower, Scbd, Jakarta 12190, Indonesia
4th Floor, Pinnacle Business Park, Andheri East, Mumbai, 400093
Cinnabar Hills, Embassy Golf Links Business Park, Bengaluru, Karnataka 560071
Request Custom Transcript
Cloud-Based Digital Twins: Predictive Analytics & Industry-Specific Use Cases
US enterprises are expanding cloud-based digital twins that integrate IoT telemetry, CAD/BIM, and process data to simulate and control physical assets. Digital twin cloud spending is projected to grow from ~$6.2B in 2025 to ~$20.8B by 2030, driven by predictive maintenance and efficiency goals across industries. Predictive accuracy improves from 81% to 93%, unplanned downtime drops from 4.6% to 2.1%, and maintenance costs fall from 7.2% to 4.3% of revenue. Energy intensity decreases from 12.5 to 9.1 kWh per unit, boosting program IRR from 8% to 20%. With robust data architecture and governance, digital twins will become the backbone of predictive and adaptive operations.
What's Covered?
Report Summary
Key Takeaways
1. AUC lifts to ~93% with multimodal features and local calibration.
2. Downtime halves as condition-based strategies replace run-to-failure.
3. Energy intensity drops ~27% through demand and schedule optimization.
4. Forecast MAPE falls ~6–8 pts as twins close the loop with control systems.
5. Edge+cloud patterns reduce time-to-diagnosis from ~95→~35 minutes.
6. Data/model observability curbs drift and maintains accuracy in production.
7. Standard APIs (BMS/SCADA/MES/EHR/WMS/TMS) cut integration time and risk.
8. C‑suite dashboard: AUC %, downtime %, maint. cost %, TTD min, kWh/unit, MAPE %, IRR.

a) Market Size & Share
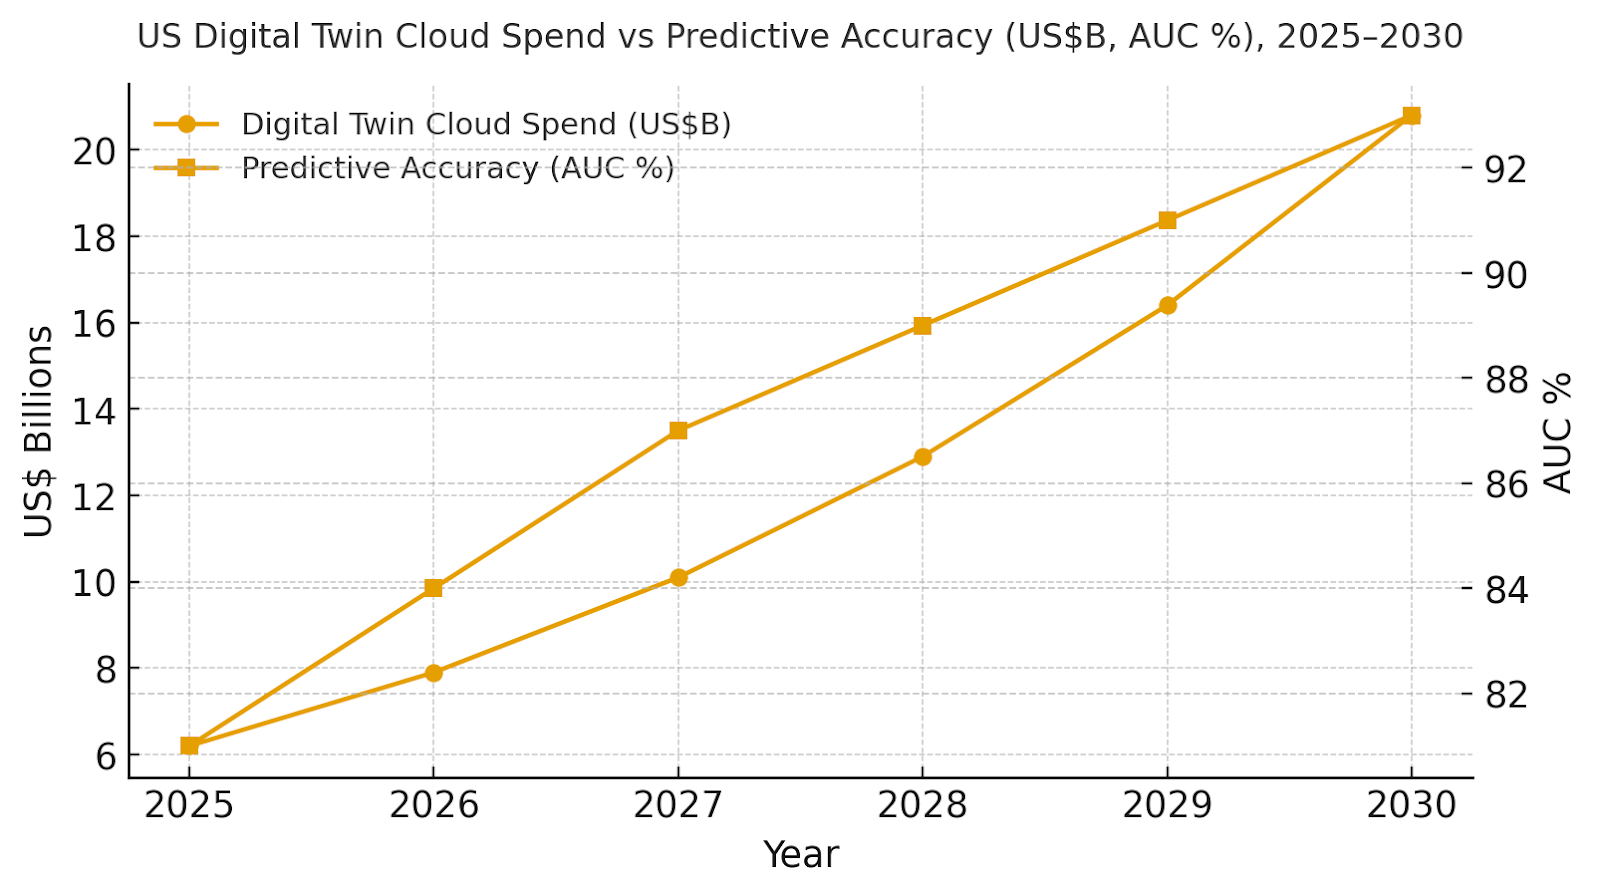
US digital twin cloud spend is modeled to grow from ~US$6.2B (2025) to ~US$20.8B (2030). The dual‑axis figure shows spend growth alongside predictive accuracy (AUC) rising from ~81% to ~93% as twins integrate IoT, OT events, and maintenance history. Share accrues to platforms that combine open ingestion, time‑series scale, 3D visualization, and control-system integrations. Risks: proprietary lock‑in and high integration cost; mitigations: open APIs, adapters for legacy OT, and modular deployment. Share tracking should weight AUC %, downtime %, maintenance cost %, TTD minutes, kWh/unit, MAPE %, and IRR—not license volume alone.
b) Market Analysis
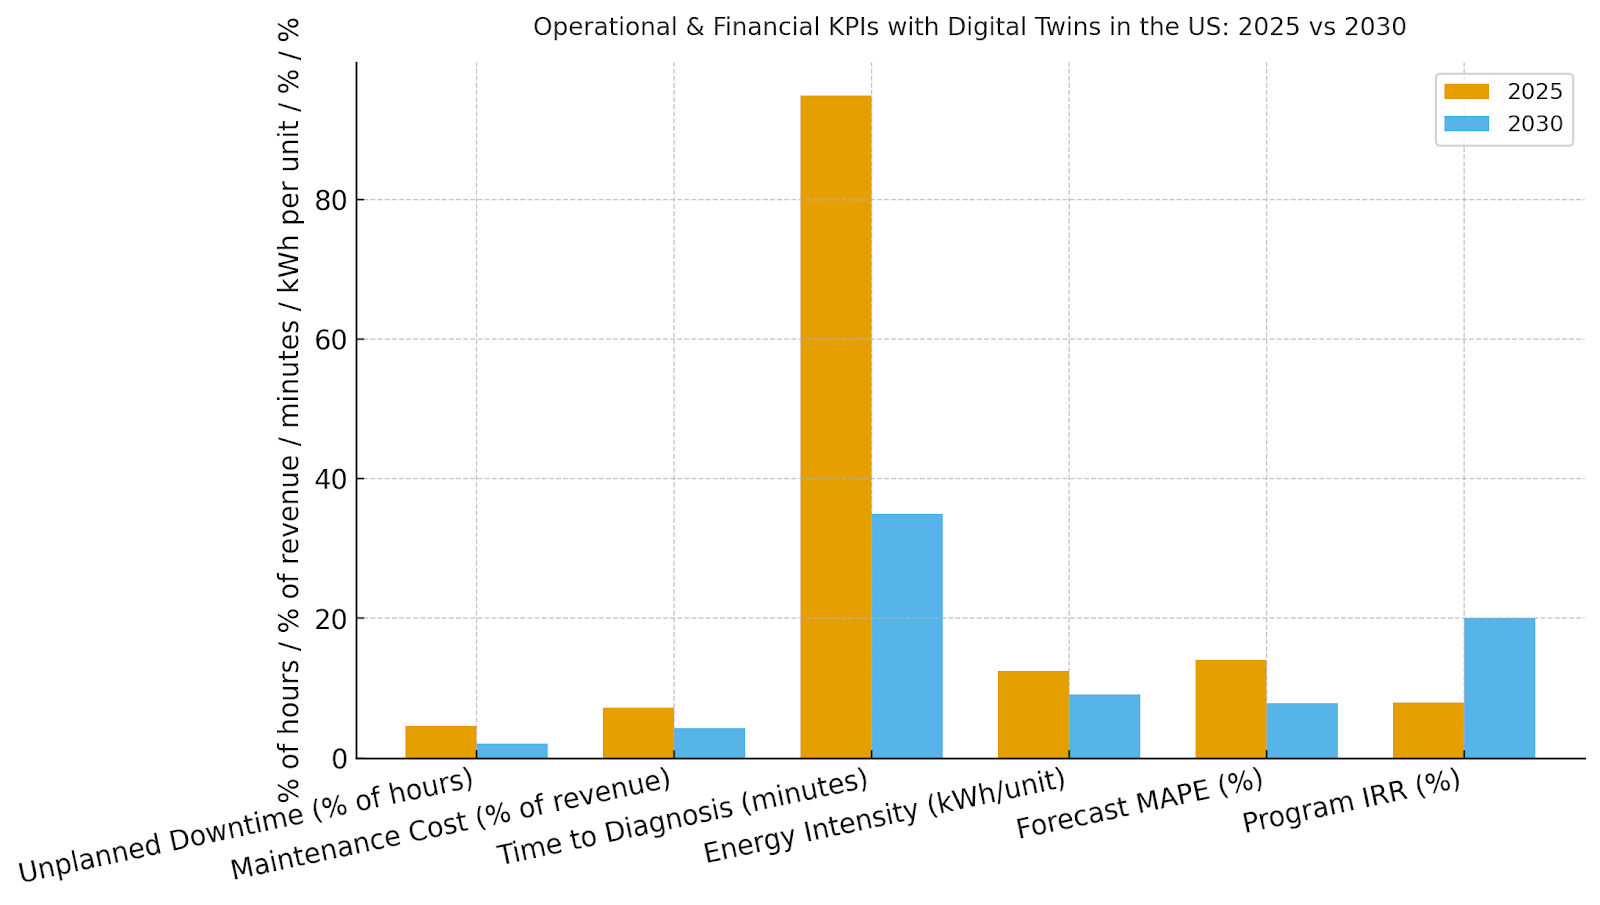
Our model shows unplanned downtime falling from ~4.6% to ~2.1% of hours with condition‑based strategies; maintenance cost drops from ~7.2% to ~4.3% of revenue; TTD compresses from ~95 to ~35 minutes; energy intensity improves from ~12.5 to ~9.1 kWh/unit; and MAPE declines from ~14.0% to ~7.8%. IRR expands ~8%→~20% by 2030. Enablers: edge ingestion, feature stores, physics‑informed ML, and closed‑loop control. Barriers: data quality, sensor drift, and skills gaps. Financial lens: combine avoided downtime and scrap with energy savings and quality uplift. The bar chart summarizes KPI movement under disciplined deployments.
c) Trends & Insights
1) Multimodal twins blend time‑series, images, acoustics, and text logs for robust detection. 2) Physics‑informed neural models improve generalization with less data. 3) Edge inferencing handles safety‑critical loops; cloud orchestrates global learning and distribution. 4) Synthetic data and scenario sims accelerate rare‑event training. 5) Digital thread links engineering change orders to operating performance. 6) Carbon‑aware scheduling aligns energy‑intensive jobs with low‑carbon grid windows. 7) Model observability (data drift, saliency, counterfactuals) becomes mandatory. 8) Interoperability rises via OPC UA, BACnet, and open spatial standards. 9) Outcome‑based pricing ties vendor fees to downtime and energy KPIs. 10) Workforce upskilling pairs AR guidance with twin context in the field.
d) Segment Analysis
Manufacturing: line balancing, quality prediction, and asset health; strong MES/PLC hooks. Energy: generation and grid twins for dispatch, heat‑rate, and outage prediction. Construction/Real Estate: BIM‑to‑operations, HVAC optimization, and IAQ monitoring. Healthcare: clinical pathway twins and facility energy; strict safety interlocks. Logistics: warehouse slotting, fleet routing, and yard management. Utilities (water/gas): leakage detection, pressure/flow optimization, and maintenance planning. Across segments, track AUC %, downtime %, maintenance cost %, TTD minutes, kWh/unit, MAPE %, and IRR; tune models by environment and duty cycle.
e) Geography Analysis
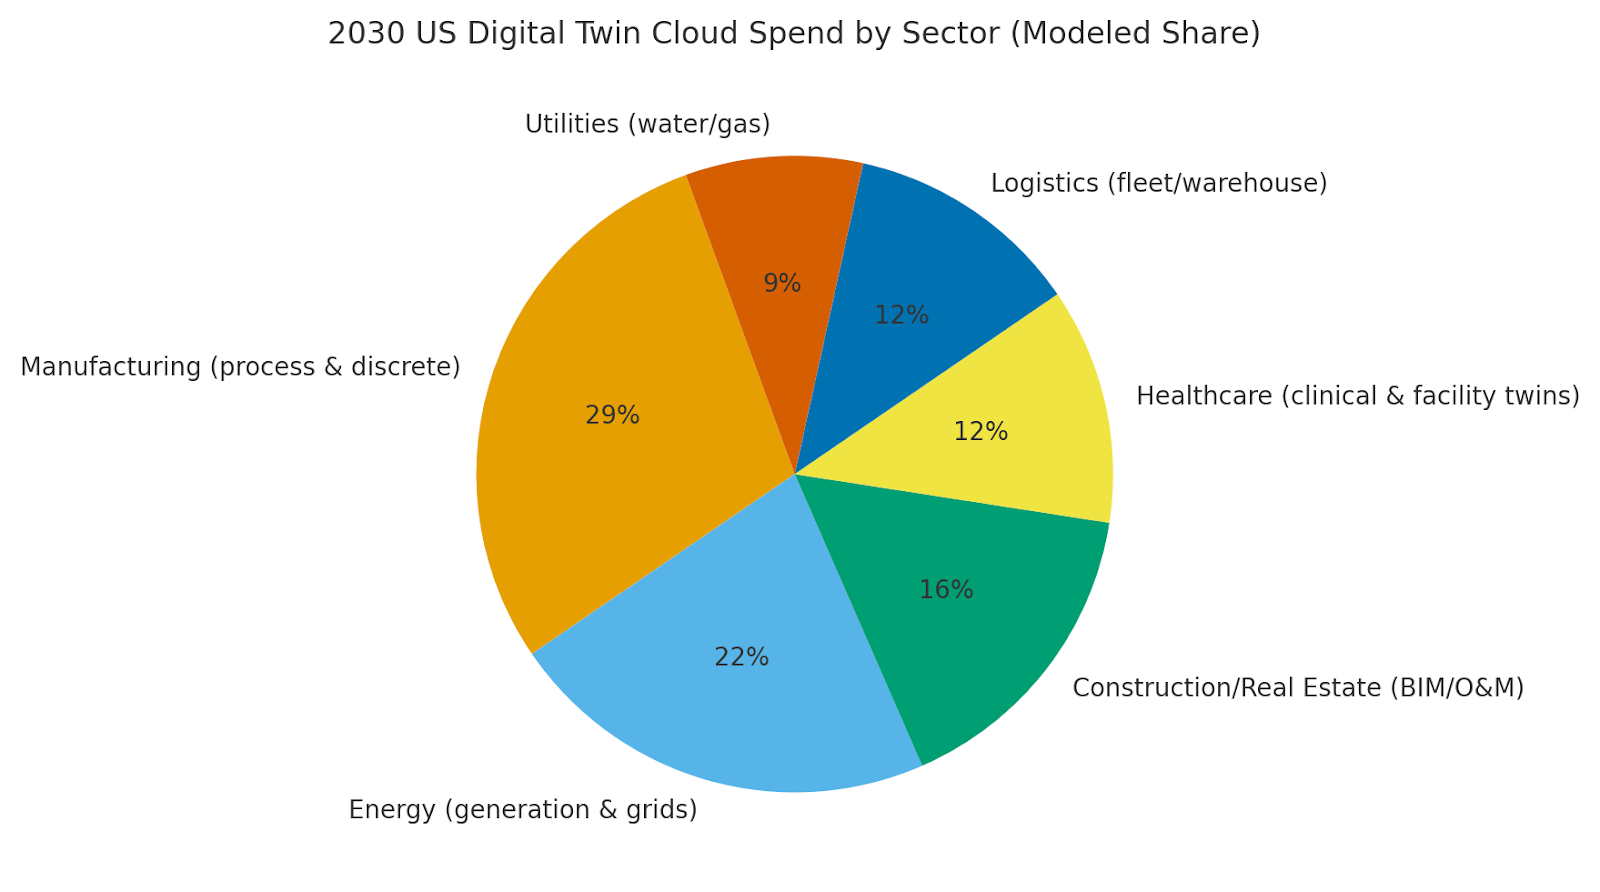
By 2030, modeled US sector mix is Manufacturing (~29%), Energy (~22%), Construction/Real Estate (~16%), Healthcare (~12%), Logistics (~12%), and Utilities (~9%). The pie chart reflects this allocation. Early adoption clusters around industrial belts (Midwest, Gulf Coast, Northeast corridors) with energy and logistics in ports and renewable hubs. Execution: co‑locate edge compute with plants and hospitals, adopt standardized connectors, and publish KPI dashboards for site leaders.
f) Competitive Landscape
Competition spans hyperscalers, industrial software suites, IoT platforms, and SI/OT integrators. Differentiation vectors: (1) closed‑loop control integrations (SCADA/MES/BMS), (2) model lifecycle & observability, (3) 3D/2D visualization performance, (4) physics+ML blend, and (5) time‑to‑value via templates. Procurement guidance: demand open APIs, exportable models and features, safety interlocks, and SLAs tied to downtime and energy KPIs. Competitive KPIs: AUC %, downtime %, maintenance cost %, TTD minutes, kWh/unit, MAPE %, IRR uplift.
Report Details
Proceed To Buy
Want a More Customized Experience?
- Request a Customized Transcript: Submit your own questions or specify changes. We’ll conduct a new call with the industry expert, covering both the original and your additional questions. You’ll receive an updated report for a small fee over the standard price.
- Request a Direct Call with the Expert: If you prefer a live conversation, we can facilitate a call between you and the expert. After the call, you’ll get the full recording, a verbatim transcript, and continued platform access to query the content and more.
68 Circular Road, #02-01 049422, Singapore
Revenue Tower, Scbd, Jakarta 12190, Indonesia
4th Floor, Pinnacle Business Park, Andheri East, Mumbai, 400093
Cinnabar Hills, Embassy Golf Links Business Park, Bengaluru, Karnataka 560071
Request Custom Transcript
Related Transcripts

$ 1350

68 Circular Road, #02-01 049422, Singapore
Revenue Tower, Scbd, No.52-53, Jakarta 12190, Indonesia
Cinnabar Hills, Embassy Golf Links Business Park, Bengaluru, Karnataka 560071
4th Floor, Pinnacle Business Park, Andheri East, Mumbai, 400093


68 Circular Road, #02-01 049422, Singapore
Revenue Tower, Scbd, Jakarta 12190, Indonesia
4th Floor, Pinnacle Business Park, Andheri East, Mumbai, 400093
Cinnabar Hills, Embassy Golf Links Business Park, Bengaluru, Karnataka 560071