

68 Circular Road, #02-01 049422, Singapore
Revenue Tower, Scbd, Jakarta 12190, Indonesia
4th Floor, Pinnacle Business Park, Andheri East, Mumbai, 400093
Cinnabar Hills, Embassy Golf Links Business Park, Bengaluru, Karnataka 560071


Connect With Us


68 Circular Road, #02-01 049422, Singapore
Revenue Tower, Scbd, Jakarta 12190, Indonesia
4th Floor, Pinnacle Business Park, Andheri East, Mumbai, 400093
Cinnabar Hills, Embassy Golf Links Business Park, Bengaluru, Karnataka 560071
Connect With Us
68 Circular Road, #02-01 049422, Singapore
Revenue Tower, Scbd, Jakarta 12190, Indonesia
4th Floor, Pinnacle Business Park, Andheri East, Mumbai, 400093
Cinnabar Hills, Embassy Golf Links Business Park, Bengaluru, Karnataka 560071
Request Custom Transcript
Cloud-Based Digital Twin Cities: IoT Integration & Sustainability Modeling
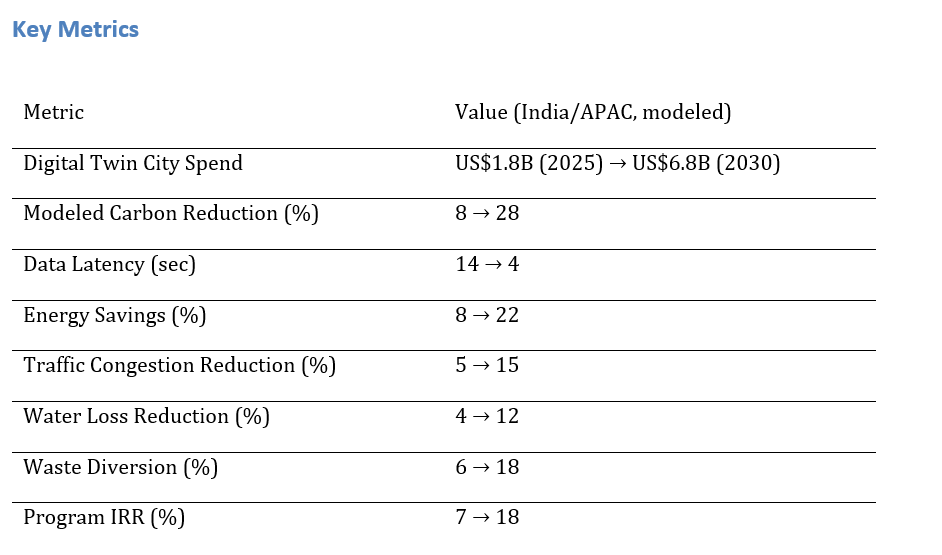
India’s smart city programs are advancing into digital twin ecosystems powered by cloud IoT integration and real-time analytics. Spending on digital twin platforms is projected to grow from ~$1.8B in 2025 to ~$6.8B by 2030, driven by modernization and sustainability goals. Carbon reduction improves from 8% to 28%, energy savings rise from 8% to 22%, and water loss reduction increases from 4% to 12%. Data latency drops from 14 to 4 seconds through edge computing and 5G. With interoperable data standards and open geospatial models, digital twins enable adaptive, efficient, and sustainable urban operations across India’s next-generation smart cities.
What's Covered?
Report Summary
Key Takeaways
1. Digital twin adoption drives ~3.7× spend growth across Indian metros by 2030.
2. Edge‑enabled IoT reduces latency to ~4 seconds for real‑time responses.
3. Carbon reduction modeled to improve from 8% → 28% via optimized assets.
4. Energy savings reach ~22% through ML‑based demand forecasting.
5. Traffic congestion down ~15% with adaptive signal optimization.
6. Waste diversion doubles with predictive collection routing.
7. Water loss declines with flow sensors and anomaly detection models.
8. C‑suite dashboard: carbon %, latency sec, energy %, congestion %, water %, waste %, IRR.
a) Market Size & Share
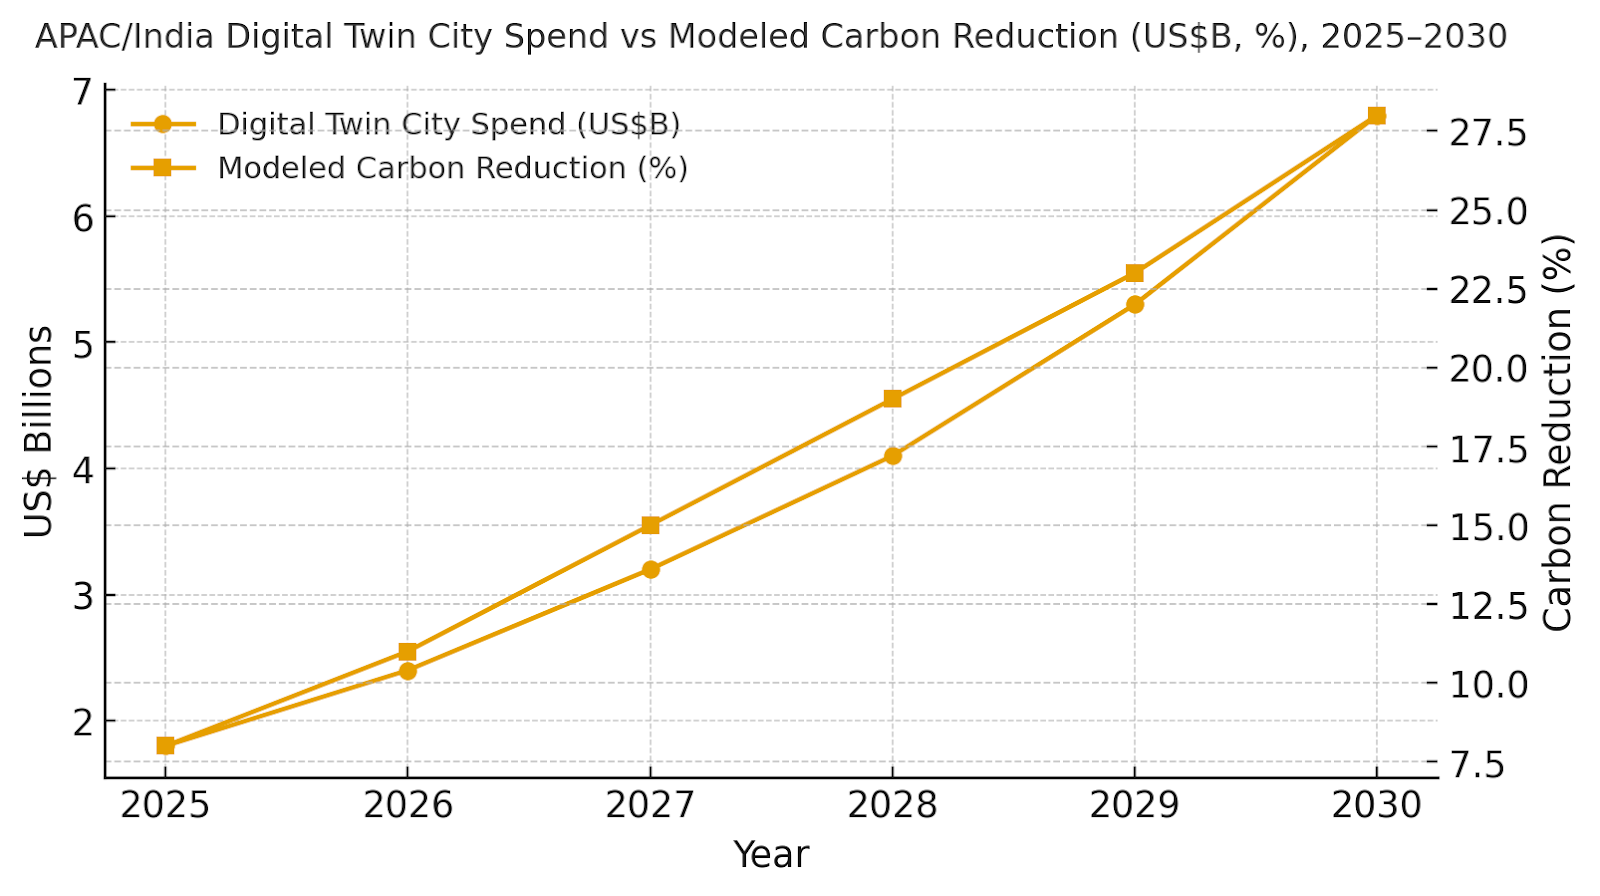
India/APAC spend on cloud‑based digital twin city infrastructure is projected to rise from ~US$1.8B in 2025 to ~US$6.8B in 2030, reflecting municipal modernization and sustainability mandates. The dual‑axis figure shows spend increasing alongside modeled carbon reduction improving from ~8% to ~28%. Share consolidates among vendors with scalable cloud‑IoT integration, geospatial APIs, and open data models. Execution risks include fragmented ownership and inadequate IoT integration; mitigations: unified data standards, federated governance, and cross‑departmental pilots. Performance tracking should focus on carbon %, latency sec, energy %, congestion %, water %, waste %, and IRR—not platform count alone.
b) Market Analysis
Latency improvements (14 → 4 sec) drive the transition from monitoring to automated control. Energy savings (~8 → 22%) and congestion reduction (~5 → 15%) represent top ROI sources. Water loss reduction (~4 → 12%) and waste diversion (~6 → 18%) amplify sustainability impact. Program IRR reaches ~18% with ESG financing and performance‑linked savings. Enablers: interoperable IoT networks, ML‑driven optimization, and API governance. Barriers: funding fragmentation, data ownership, and workforce gaps. Financial view: cost avoidance, carbon credits, and asset longevity combine to lift IRR. The bar figure shows KPI improvements achieved through real‑time analytics and digital twin orchestration.

c) Trends & Insights
1) Multi‑layer digital twins link infrastructure, mobility, and environment models. 2) Edge computing and 5G reduce IoT data latency below 5s for adaptive response. 3) AI models predict water leakage, traffic congestion, and air quality in real time. 4) Carbon‑aware scheduling aligns city operations to renewable availability. 5) Citizen digital twins link behavioral data with service planning. 6) Blockchain‑verified ESG reporting ensures integrity of sustainability data. 7) Cloud‑based simulation reduces planning cycles by >40%. 8) Privacy‑preserving analytics (federated learning) protect citizen data. 9) Integration of IoT twins with financing systems enables pay‑for‑performance. 10) Open twin standards enable inter‑city benchmarking across India and Southeast Asia.
d) Segment Analysis
Urban Mobility: adaptive traffic lights, EV charging, and route optimization; key KPIs: congestion %, latency sec. Energy & Utilities: demand forecasting, grid balancing, and outage prediction; KPIs: energy %, carbon %. Water Management: leakage detection, flow optimization, and predictive maintenance. Waste Systems: smart collection routing, bin fill analytics, and recycling prediction. Environment: air‑quality modeling and emission forecasting. Public Safety: CCTV analytics, hazard prediction, and emergency simulation. Each sector contributes to IRR and carbon impact metrics.
e) Geography Analysis
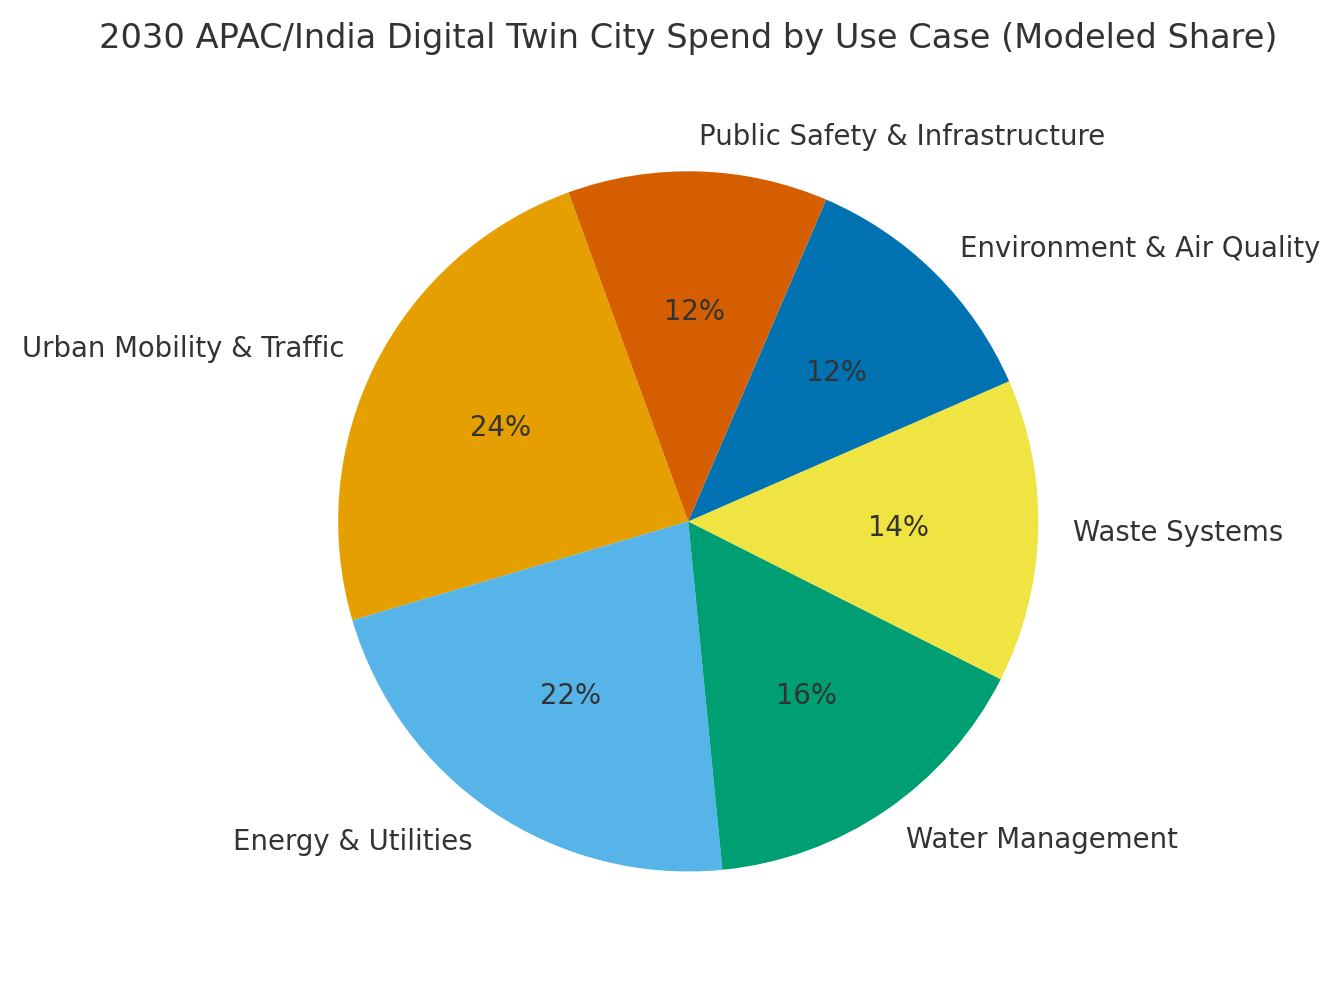
By 2030, modeled spend mix includes Urban Mobility (~24%), Energy & Utilities (~22%), Water Management (~16%), Waste (~14%), Environment (~12%), and Public Safety (~12%). India’s Tier‑1 metros (Delhi, Mumbai, Bengaluru, Chennai) lead deployment, followed by secondary cities (Pune, Hyderabad, Ahmedabad). ASEAN replication expected by 2028. Execution focus: IoT integration standards, cloud interoperability, and ESG‑aligned outcomes. The pie chart illustrates 2030 sectoral allocation across APAC/India twin initiatives.
f) Competitive Landscape
Competition spans hyperscale cloud providers, IoT network operators, GIS firms, and systems integrators. Differentiation vectors: (1) interoperability and open APIs; (2) data governance and sovereignty controls; (3) simulation accuracy and speed; (4) carbon and ESG analytics depth; and (5) time‑to‑value through pre‑built urban models. Procurement guidance: require open APIs, edge‑ready data pipelines, carbon dashboards, and SLAs for latency, uptime, and accuracy. Competitive KPIs: carbon %, latency sec, energy %, congestion %, water %, waste %, IRR uplift.
Report Details
Proceed To Buy
Want a More Customized Experience?
- Request a Customized Transcript: Submit your own questions or specify changes. We’ll conduct a new call with the industry expert, covering both the original and your additional questions. You’ll receive an updated report for a small fee over the standard price.
- Request a Direct Call with the Expert: If you prefer a live conversation, we can facilitate a call between you and the expert. After the call, you’ll get the full recording, a verbatim transcript, and continued platform access to query the content and more.
68 Circular Road, #02-01 049422, Singapore
Revenue Tower, Scbd, Jakarta 12190, Indonesia
4th Floor, Pinnacle Business Park, Andheri East, Mumbai, 400093
Cinnabar Hills, Embassy Golf Links Business Park, Bengaluru, Karnataka 560071
Request Custom Transcript
Related Transcripts


68 Circular Road, #02-01 049422, Singapore
Revenue Tower, Scbd, No.52-53, Jakarta 12190, Indonesia
Cinnabar Hills, Embassy Golf Links Business Park, Bengaluru, Karnataka 560071
4th Floor, Pinnacle Business Park, Andheri East, Mumbai, 400093


68 Circular Road, #02-01 049422, Singapore
Revenue Tower, Scbd, Jakarta 12190, Indonesia
4th Floor, Pinnacle Business Park, Andheri East, Mumbai, 400093
Cinnabar Hills, Embassy Golf Links Business Park, Bengaluru, Karnataka 560071