

68 Circular Road, #02-01 049422, Singapore
Revenue Tower, Scbd, Jakarta 12190, Indonesia
4th Floor, Pinnacle Business Park, Andheri East, Mumbai, 400093
Cinnabar Hills, Embassy Golf Links Business Park, Bengaluru, Karnataka 560071


Connect With Us


68 Circular Road, #02-01 049422, Singapore
Revenue Tower, Scbd, Jakarta 12190, Indonesia
4th Floor, Pinnacle Business Park, Andheri East, Mumbai, 400093
Cinnabar Hills, Embassy Golf Links Business Park, Bengaluru, Karnataka 560071
Connect With Us
68 Circular Road, #02-01 049422, Singapore
Revenue Tower, Scbd, Jakarta 12190, Indonesia
4th Floor, Pinnacle Business Park, Andheri East, Mumbai, 400093
Cinnabar Hills, Embassy Golf Links Business Park, Bengaluru, Karnataka 560071
Request Custom Transcript
Cloud-Based Digital Identity Solutions: Biometric Authentication & Fraud Prevention
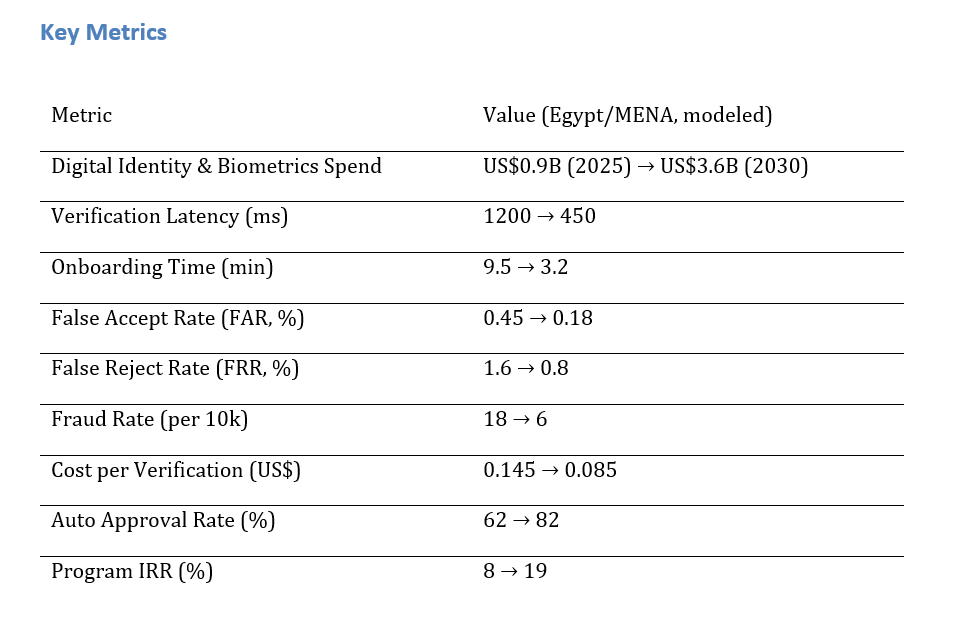
Egypt’s digital economy is embracing cloud-based identity platforms combining biometrics, liveness detection, and risk scoring to streamline verification. Spending is projected to rise from ~$0.9B in 2025 to ~$3.6B by 2030 as banks, telecoms, and e-commerce unify KYC/KYB and authentication. Verification latency drops from 1200ms to 450ms, onboarding time from 9.5 to 3.2 minutes, and fraud from 18 to 6 per 10k applications. FAR decreases from 0.45% to 0.18%, while automated approvals climb from 62% to 82%. With consent-first capture, policy-as-code decisions, and privacy-compliant infrastructure, cloud identity will drive both trust and revenue across Egypt’s digital ecosystem.

What's Covered?
Report Summary
Key Takeaways
1. GPU‑accelerated biometrics and regional PoPs cut latency to ~450ms by 2030.
2. OCR+NFC+guided capture reduces onboarding time to ~3.2 minutes.
3. Multi‑trait biometrics with adaptive thresholds lower FAR/FRR materially.
4. Behavioral and device intelligence reduce fraud to ~6 per 10k applications.
5. Serverless inference and traffic shaping lower $/verification ~40%+.
6. Bias audits, accessibility features, and liveness hardening improve equity and security.
7. Policy‑as‑code and case management standardize decisions and reviews.
8. C‑suite dashboard: ms latency, min onboarding, FAR/FRR %, fraud/10k, $/verify, auto‑approve %, IRR.
a) Market Size & Share
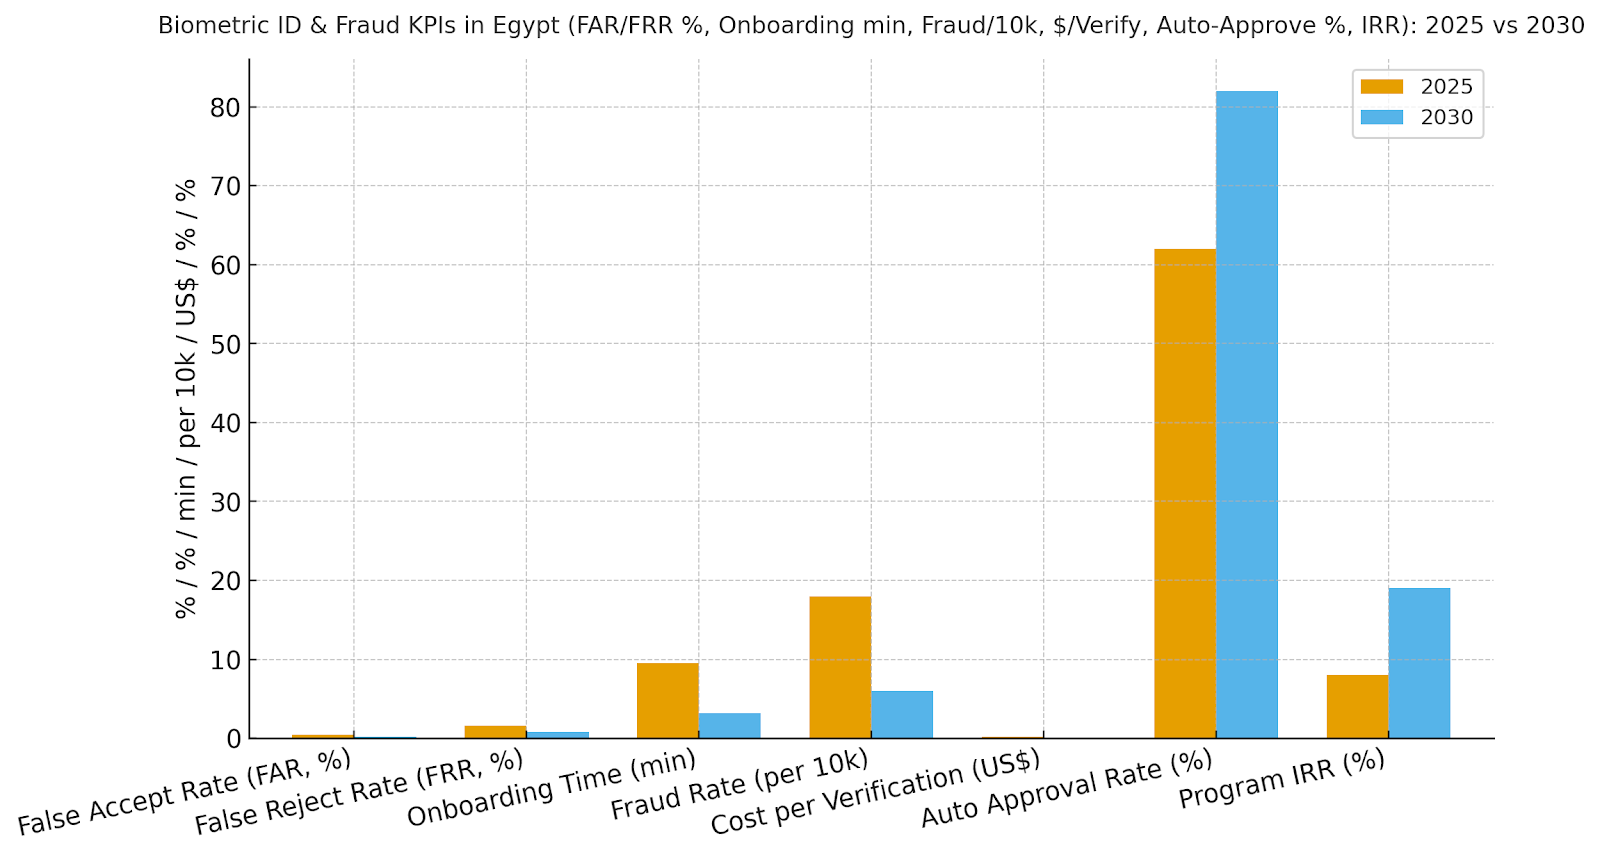
Egypt/MENA digital identity spend is modeled to grow from ~US$0.9B in 2025 to ~US$3.6B by 2030 as sectors converge on cloud platforms for onboarding and step‑up authentication. The dual‑axis figure shows spend rising alongside verification latency dropping from ~1200ms to ~450ms. Share concentrates with vendors that offer (1) multi‑trait biometrics and robust liveness; (2) document verification with NFC support; (3) device intelligence and fraud graphs; and (4) regional PoPs with strong SLAs. Risks: spoofing tools, demographic bias, and inconsistent mobile capture; mitigations: multi‑factor liveness, bias audits, and guided capture. Share tracking should weight ms latency, onboarding minutes, FAR/FRR %, fraud/10k, $/verification, auto‑approve %, and IRR—not logos alone.

b) Market Analysis
Our model shows onboarding time falling ~66% and latency ~63% as GPU inference and NFC reads mature. FAR drops from ~0.45% to ~0.18% and FRR from ~1.6% to ~0.8% with multi‑trait fusion and localized thresholds. Fraud declines from ~18 to ~6 per 10k via device and behavior analytics; $/verification improves from ~$0.145 to ~$0.085 with serverless execution. Auto‑approval rises from ~62% to ~82%, and program IRR grows from ~8% to ~19% by 2030. Enablers: regional PoPs, liveness hardening, and case management. Barriers: low‑light capture, document wear, and network jitter. Financial lens: combine fraud avoided and review labor saved with increased conversion. The bar figure summarizes KPI shifts.
c) Trends & Insights
1) Multi‑trait biometrics (face/voice/fingerprint) with passive‑first liveness reduce friction. 2) On‑device pre‑processing stabilizes low‑end camera capture. 3) Fraud graphs fuse device, SIM, IP, and identity entities to detect mule/ring activity. 4) NFC‑first document reads improve accuracy and speed. 5) Policy‑as‑code defines decisions across channels. 6) Regional PoPs and QUIC/HTTP3 improve jitter and tail latency. 7) Privacy dashboards expose consent, retention, and data export. 8) Bias monitoring becomes continuous with cohort analytics. 9) Explainable decisions aid regulator reviews. 10) Outcome‑based pricing aligns vendor fees to fraud reduction and conversion lift.
d) Segment Analysis
Banking/Fintech: KYC/KYB, account opening, and step‑up auth; integrate AML lists. Government eID: citizen services, e‑payments, and permits; strong localization and accessibility. Telecom: SIM registration and fraud prevention; device graph central. E‑commerce/Payments: checkout risk, BNPL onboarding; emphasis on conversion. Travel/Border: rapid identity checks and watchlist screening. Healthcare: e‑pharmacy and patient portal access. Across segments, track ms latency, onboarding minutes, FAR/FRR %, fraud/10k, $/verification, auto‑approve %, and IRR; refine thresholds per risk tier.
e) Geography Analysis
By 2030, we model Egypt/MENA spend/use‑case mix as Banking/Fintech (~26%), Government eID (~22%), Telecom SIM (~18%), E‑commerce & Payments (~14%), Travel/Border (~12%), and Healthcare (~8%). The pie figure reflects the mix. Cairo and Alexandria lead with banking and telecom projects; government eID catalyzes wider interoperability. Execution: deploy metro PoPs, enforce privacy and consent, and publish KPI dashboards with bias/burden metrics.

f) Competitive Landscape
Competition spans cloud providers, identity verification vendors, biometric SDKs, fraud platforms, and systems integrators. Differentiation vectors: (1) liveness robustness and multi‑trait accuracy, (2) latency at tail percentiles and PoP coverage, (3) fraud graph depth and device intelligence, (4) privacy tooling and audit logs, and (5) time‑to‑value via templates and case management. Procurement guidance: require open APIs, exportable evidence logs, SLAs for latency/accuracy, and quarterly bias audits. Competitive KPIs: ms latency, onboarding minutes, FAR/FRR %, fraud/10k, $/verification, auto‑approve %, and IRR uplift.
Report Details
Proceed To Buy
Want a More Customized Experience?
- Request a Customized Transcript: Submit your own questions or specify changes. We’ll conduct a new call with the industry expert, covering both the original and your additional questions. You’ll receive an updated report for a small fee over the standard price.
- Request a Direct Call with the Expert: If you prefer a live conversation, we can facilitate a call between you and the expert. After the call, you’ll get the full recording, a verbatim transcript, and continued platform access to query the content and more.
68 Circular Road, #02-01 049422, Singapore
Revenue Tower, Scbd, Jakarta 12190, Indonesia
4th Floor, Pinnacle Business Park, Andheri East, Mumbai, 400093
Cinnabar Hills, Embassy Golf Links Business Park, Bengaluru, Karnataka 560071
Request Custom Transcript
Related Transcripts


68 Circular Road, #02-01 049422, Singapore
Revenue Tower, Scbd, No.52-53, Jakarta 12190, Indonesia
Cinnabar Hills, Embassy Golf Links Business Park, Bengaluru, Karnataka 560071
4th Floor, Pinnacle Business Park, Andheri East, Mumbai, 400093


68 Circular Road, #02-01 049422, Singapore
Revenue Tower, Scbd, Jakarta 12190, Indonesia
4th Floor, Pinnacle Business Park, Andheri East, Mumbai, 400093
Cinnabar Hills, Embassy Golf Links Business Park, Bengaluru, Karnataka 560071