

68 Circular Road, #02-01 049422, Singapore
Revenue Tower, Scbd, Jakarta 12190, Indonesia
4th Floor, Pinnacle Business Park, Andheri East, Mumbai, 400093
Cinnabar Hills, Embassy Golf Links Business Park, Bengaluru, Karnataka 560071


Connect With Us


68 Circular Road, #02-01 049422, Singapore
Revenue Tower, Scbd, Jakarta 12190, Indonesia
4th Floor, Pinnacle Business Park, Andheri East, Mumbai, 400093
Cinnabar Hills, Embassy Golf Links Business Park, Bengaluru, Karnataka 560071
Connect With Us
68 Circular Road, #02-01 049422, Singapore
Revenue Tower, Scbd, Jakarta 12190, Indonesia
4th Floor, Pinnacle Business Park, Andheri East, Mumbai, 400093
Cinnabar Hills, Embassy Golf Links Business Park, Bengaluru, Karnataka 560071
Request Custom Transcript
Circular Fashion Ecosystem Development: Asia's Textile Waste Recycling Innovations
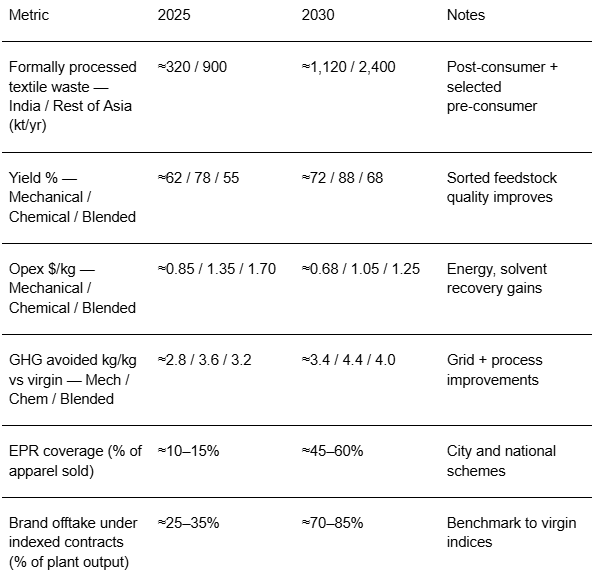
Between 2025 and 2030, Asia led by India’s textile hubs shifts from fragmented post‑consumer collection to integrated circular fashion ecosystems. Municipal partnerships, EPR schemes, and brand‑backed take‑back programs feed standardized sorting centers, while mechanical recycling for cotton, chemical depolymerization for polyester, and blended‑fiber separation for poly‑cotton scale in parallel. The winning operating model decouples feedstock aggregation from technology ownership: feedstock companies consolidate collection and grading; technology platforms run multi‑tenant plants; and offtake is de‑risked via indexed contracts with brands and mills. Quantitatively, this illustrative outlook shows India’s formally processed post‑consumer textile waste rising from ~320 kt in 2025 to ~1,120 kt by 2030, with the rest of Asia growing from ~900 kt to ~2,400 kt.
What's Covered?
Report Summary
Key Takeaways
1. Feedstock quality is the growth bottleneck invest first in collection and sorting standardization.
2. Run a portfolio of technologies: mechanical for cotton, chemical depoly for PET, blended separation for poly‑cotton.
3. Indexed offtake tied to virgin benchmarks stabilizes pricing and de‑risks project finance.
4. Mass‑balance and MRV are must‑haves for brand claims and carbon credit stacking.
5. Water, solvent, and worker‑safety KPIs matter as much as yield adopt ZDHC/REACH‑aligned designs.
6. EPR and city partnerships unlock scale; include informal sector integration and fair‑pay models.
7. Regional hubs (GJ/MH, TN)become anchor ecosystems with multi‑tenant plants and shared logistics.
8. Outcome‑based contracts indexed to tons processed, yield, and GHG avoidance align incentives.
Key Metrics
Market Size & Share
Formal collection and processing scale as EPR programs, brand take‑back, and city pilots standardize flows. In this illustrative outlook, India’s processed post‑consumer textile waste grows from ~320 kt in 2025 to ~1,120 kt in 2030; the rest of Asia from ~900 kt to ~2,400 kt. Share accrues to regions that combine dense apparel consumption, upgraded MRFs, and access to rail/port logistics. In India, West (Gujarat/Maharashtra) and South (Tamil Nadu/Karnataka) anchor growth with proximity to mills and export hubs.
Players that separate feedstock aggregation from technology capture more share—consolidators lock supply contracts with cities and brands, while tech operators run high‑utilization plants with bankable offtake. By 2030, multi‑tenant platforms with modular lines (mechanical, depoly, blended separation) service diverse waste profiles and secure indexed offtake tied to virgin cotton/PET benchmarks.

Market Analysis
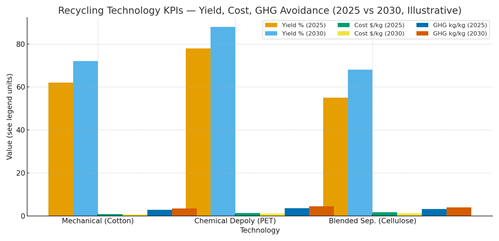
Technology performance improves with cleaner feedstock and process intensification. In this outlook, cotton mechanical yield rises ~10 pp as color sorting and contamination control improve; PET depolymerization yield gains ~10 pp with catalyst and solvent optimization; blended‑fiber separation advances ~13 pp as solvent recovery and cellulose stabilization mature. Opex drops 15–30% via energy recovery and solvent loops; GHG avoidance improves by ~0.6–0.8 kg/kg fiber versus virgin baselines. Cost stack: collection/logistics (~25–35%), sorting (~10–15%), processing energy/chemicals (~30–40%), and overheads (~10–15%). Value stack: brand compliance, recycled content claims, carbon credits (where eligible), and avoided landfill fees.
Risks: mixed waste quality; water/solvent management; worker safety; and offtake volatility. Mitigations: standardized bag/tag schemes with incentives; ZDHC/REACH alignment; closed‑loop water/solvent systems; indexed offtake with floors/collars; and transparent MRV to protect brand claims and credit eligibility.
Trends & Insights (2025–2030)
• EPR and brand take‑back expand collection; digital bag/tag with QR enables traceability and payments to collectors.
• Tiered sorting by color/fiber percent reduces contamination and raises plant capacity factors.
• Chemical depolymerization and blended separation co‑locate near mechanical lines to flex with feedstock.
• MRV frameworks mature mass‑balance, chain of custody, and GHG factors audited for brand reporting/credits.
• Water and solvent minimization technologies (membranes, heat integration) become license conditions.
• Indexed offtake contracts align recycled fiber pricing with virgin markets, improving bankability.
• Informal sector integration with safety gear and fair pricing improves feedstock reliability.
• DFIs and climate funds co‑finance plants tied to traceability and sustainability KPIs.
Segment Analysis (Feedstock & Product)
• Cotton‑heavy streams: best fit for mechanical recycling to open‑end yarn; premium lines for ring‑spun when feedstock is clean.
• PET/polyester: chemical depolymerization to PTA/MEG or BHET for rPET pellets and filament; co‑locate with bottle‑to‑fiber where possible.
• Poly‑cotton blends: solvent‑based separation to cellulose pulp and PET/rPET; growing demand for viscose/lyocell inputs.
• Dark/contaminated textiles: downcycle to insulation or route to energy recovery with emissions controls.
Buyer guidance: map city feedstock profiles to technology routes; design modular lines; secure indexed offtake; and implement MRV from day one.
Geography Analysis (Asia & India)
Readiness concentrates in India West (GJ/MH) and South (TN/KR) with mill clusters, ports, and policy momentum; India North and East/NE need investments in collection and sorting. Bangladesh and Vietnam combine export‑oriented mills with rising brand demand; Indonesia scales via industrial parks; China leads on installed technology depth. The stacked criteria—collection systems, sorting/grading, installed technology, policy/incentives, and brand offtake indicate where production SLAs can be met first for circular fiber supply.
Implications: stage deployments in high‑readiness hubs; standardize sorting specs; secure indexed offtake; and align with EPR and water/solvent standards to accelerate permits and finance.

Competitive Landscape (Platforms & Operating Models)
Stacks converge on: (i) feedstock aggregation & traceability; (ii) sorting tech (NIR, color, fiber %); (iii) processing tech (mechanical, depoly, blended separation) with utilities integration; (iv) MRV and mass‑balance; and (v) offtake contracting & logistics. Differentiators: yield at scale with mixed feedstock, solvent/water intensity, safety credentials, and bankable offtake. System integrators package city collection with MRF upgrades; plant operators run multi‑tenant lines; brands commit volumes via indexed contracts. Contracts shift toward outcome pricing indexed to tons processed, yield, and GHG avoidance, under audited MRV and sustainability covenants.
Report Details
Proceed To Buy
Want a More Customized Experience?
- Request a Customized Transcript: Submit your own questions or specify changes. We’ll conduct a new call with the industry expert, covering both the original and your additional questions. You’ll receive an updated report for a small fee over the standard price.
- Request a Direct Call with the Expert: If you prefer a live conversation, we can facilitate a call between you and the expert. After the call, you’ll get the full recording, a verbatim transcript, and continued platform access to query the content and more.
68 Circular Road, #02-01 049422, Singapore
Revenue Tower, Scbd, Jakarta 12190, Indonesia
4th Floor, Pinnacle Business Park, Andheri East, Mumbai, 400093
Cinnabar Hills, Embassy Golf Links Business Park, Bengaluru, Karnataka 560071
Request Custom Transcript
Related Transcripts

$ 1395


68 Circular Road, #02-01 049422, Singapore
Revenue Tower, Scbd, No.52-53, Jakarta 12190, Indonesia
Cinnabar Hills, Embassy Golf Links Business Park, Bengaluru, Karnataka 560071
4th Floor, Pinnacle Business Park, Andheri East, Mumbai, 400093


68 Circular Road, #02-01 049422, Singapore
Revenue Tower, Scbd, Jakarta 12190, Indonesia
4th Floor, Pinnacle Business Park, Andheri East, Mumbai, 400093
Cinnabar Hills, Embassy Golf Links Business Park, Bengaluru, Karnataka 560071