

68 Circular Road, #02-01 049422, Singapore
Revenue Tower, Scbd, Jakarta 12190, Indonesia
4th Floor, Pinnacle Business Park, Andheri East, Mumbai, 400093
Cinnabar Hills, Embassy Golf Links Business Park, Bengaluru, Karnataka 560071


Connect With Us


68 Circular Road, #02-01 049422, Singapore
Revenue Tower, Scbd, Jakarta 12190, Indonesia
4th Floor, Pinnacle Business Park, Andheri East, Mumbai, 400093
Cinnabar Hills, Embassy Golf Links Business Park, Bengaluru, Karnataka 560071
Connect With Us
68 Circular Road, #02-01 049422, Singapore
Revenue Tower, Scbd, Jakarta 12190, Indonesia
4th Floor, Pinnacle Business Park, Andheri East, Mumbai, 400093
Cinnabar Hills, Embassy Golf Links Business Park, Bengaluru, Karnataka 560071
Request Custom Transcript
Blockchain-Integrated Cloud Architectures: Data Integrity and Automation
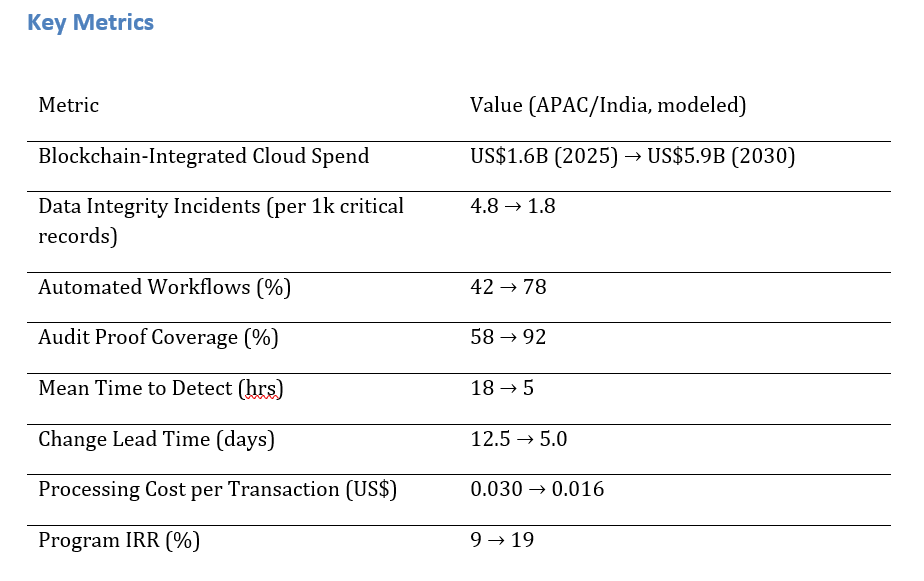
Enterprises are adopting blockchain-integrated cloud architectures to ensure tamper-evident data pipelines and secure automation. Spending is projected to grow from ~$1.6B in 2025 to ~$5.9B by 2030 as organizations seek verifiable logs, automated workflows, and regulator-ready audit trails. Data integrity incidents drop from 4.8 to 1.8 per 1,000 records, automated workflows expand from 42% to 78%, and anomaly detection time improves from 18 to 5 hours. Processing costs per transaction fall from $0.030 to $0.016, boosting program IRR from 9% to 19%. Using hybrid ledgers, proof exports, and policy-based automation, blockchain-integrated clouds enhance trust, compliance, and efficiency.
What's Covered?
Report Summary
Key Takeaways
1. Hash‑linked event streams and signed updates reduce integrity incidents ~60%.
2. Automation expands to ~78% of workflows via event triggers and smart rules.
3. Proof‑ready pipelines raise audit coverage to ~92% with exportable receipts.
4. Streaming anomaly detection cuts MTTD from ~18 to ~5 hours.
5. Change lead time halves with policy‑as‑code gates and progressive delivery.
6. Batch/roll‑up designs reduce processing cost/txn to ~US$0.016 by 2030.
7. Hybrid ledger patterns balance privacy with public verifiability for audits.
8. C‑suite dashboard: incidents/1k, auto %, audit %, MTTD hrs, lead‑time days, $/txn, IRR.
a) Market Size & Share
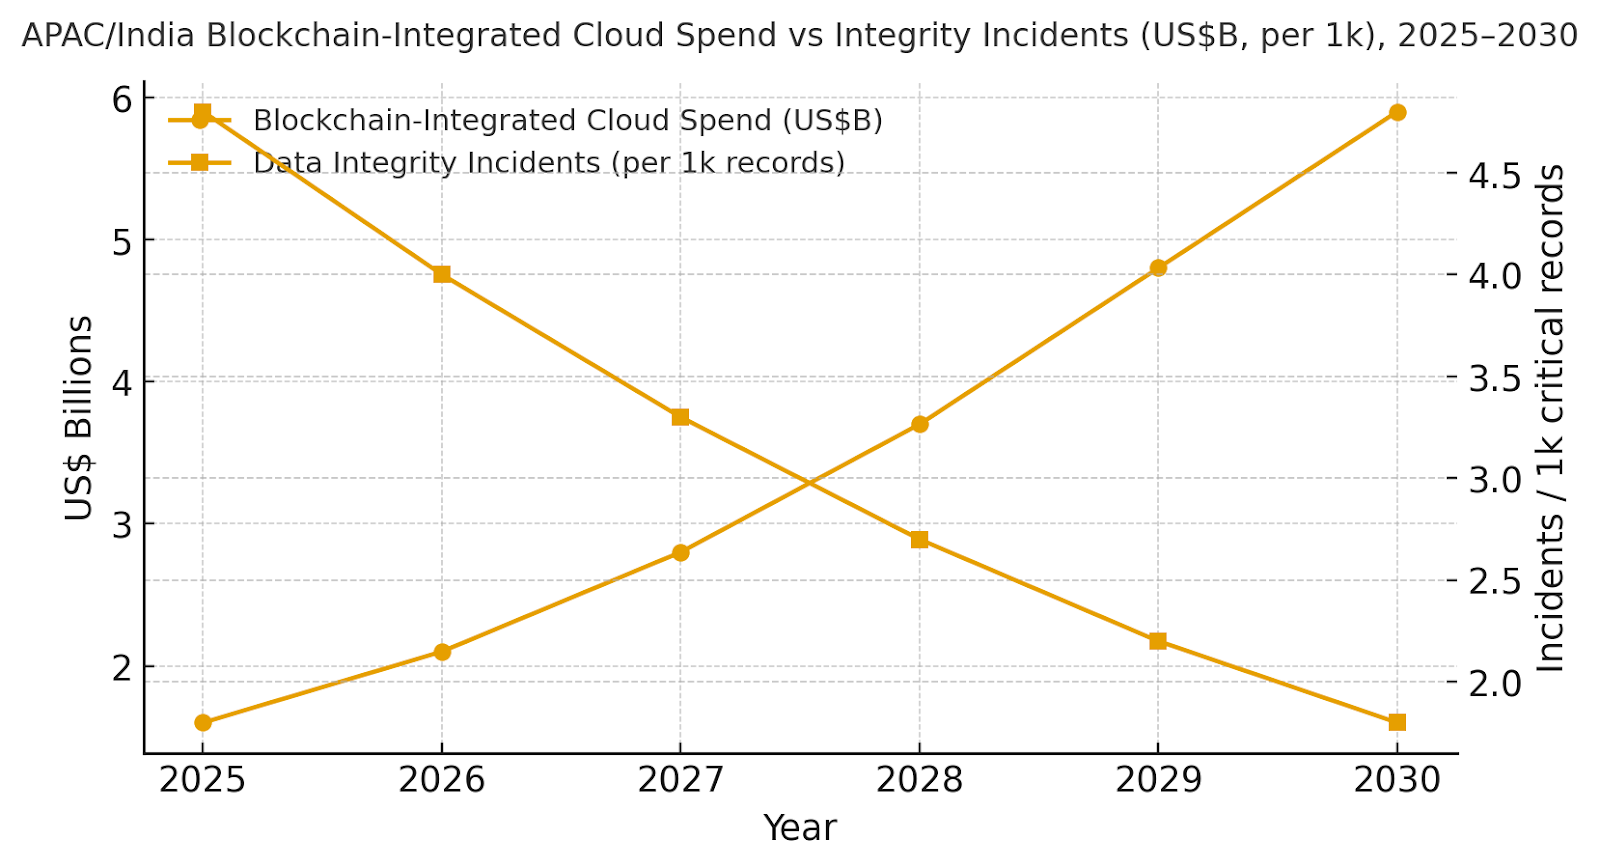
APAC/India spend on blockchain‑integrated cloud architectures is modeled to grow from ~US$1.6B in 2025 to ~US$5.9B by 2030. The dual‑axis figure shows spend rising as data integrity incidents per 1,000 critical records fall from ~4.8 to ~1.8. Share concentrates with platforms that offer identity/KMS depth, proof‑bearing data lakes, and low‑friction automation. Execution risks include metadata quality and cross‑cloud placement; mitigations include data contracts, schema registries, and egress‑aware designs. Share tracking should weigh incidents/1k, automation %, audit %, MTTD hrs, lead‑time days, $/txn, and IRR—not logos alone.
b) Market Analysis
Our model shows automation rising from ~42%→~78% of target workflows as event triggers and rule engines mature; audit proof coverage expanding from ~58%→~92%; mean time to detect anomalies improving from ~18→~5 hours; change lead time declining from ~12.5→~5 days; and processing cost per transaction dropping from ~$0.030→~$0.016 as serverless and roll‑ups scale. IRR expands from ~9%→~19% by 2030. Enablers: hash‑linked logs, KMS/HSM with envelope encryption, schema registries, and policy‑as‑code. Barriers: legacy systems without event capture, residency constraints, and cultural resistance to automation. Financial lens: combine fewer disputes/reconciliations with faster releases and new digital services. The bar figure summarizes KPI movement.

c) Trends & Insights
1) Proof‑bearing data lakes/warehouses add hash and signature columns for every batch. 2) Public anchoring via periodic Merkle roots balances cost and verifiability. 3) Event‑sourced microservices replace nightly batch ETL for traceable state changes. 4) Confidential computing and TEEs protect rules and keys in multi‑tenant clouds. 5) Policy‑as‑code governs who can automate what, with approvals tied to risk. 6) Streaming anomaly detection blends rules with ML to catch fraud and drift. 7) Digital product passports extend proofs across supply and service chains. 8) Cross‑cloud meshes standardize proof formats and verification APIs. 9) Carbon‑aware scheduling optimizes compute for proofs/verification. 10) Outcome‑based contracts tie vendor fees to incident reduction and lead‑time improvements.
d) Segment Analysis
Finance/Trade: payment and LC/BL events with proof exports for auditors. Public Sector: land records, ID credentialing, and grant disbursement with tamper‑evident logs. Healthcare: longitudinal records and consent receipts; emphasis on privacy and residency. Manufacturing: proofed quality and genealogy; integration with MES/PLM. Logistics & Customs: event capture and cross‑border verification; minimize egress during anchoring. Retail: loyalty and order integrity. Across segments, track incidents/1k, automation %, audit %, MTTD hrs, lead‑time days, $/txn, and IRR; re‑calibrate quarterly by workflow and risk level.
e) Geography Analysis
By 2030, we model APAC/India spend mix as Financial Services & Trade (~24%), Public Sector & Land/ID (~20%), Healthcare (~18%), Manufacturing & Quality (~16%), Logistics & Customs (~14%), and Retail & Loyalty (~8%). The pie figure reflects the mix. Adoption concentrates in banking hubs and export corridors (Mumbai, Delhi NCR, Bengaluru, Chennai) with public sector programs driving standards. Execution: prioritize identity/KMS readiness, minimize egress, and publish verification APIs and dashboards to auditors/regulators.

f) Competitive Landscape
Competition spans cloud providers, ledger platforms, data platforms, and systems integrators. Differentiation vectors: (1) proof‑bearing storage and query performance, (2) low‑cost anchoring and verification APIs, (3) identity/KMS depth with TEEs, (4) policy‑as‑code governance and audit tooling, and (5) time‑to‑value via templates. Procurement guidance: require open APIs, exportable receipts/proofs, SLAs for proof generation/verification, and cost models for anchoring/egress. Competitive KPIs: incidents/1k, automation %, audit %, MTTD hrs, lead‑time days, $/txn, and IRR uplift.
Report Details
Proceed To Buy
Want a More Customized Experience?
- Request a Customized Transcript: Submit your own questions or specify changes. We’ll conduct a new call with the industry expert, covering both the original and your additional questions. You’ll receive an updated report for a small fee over the standard price.
- Request a Direct Call with the Expert: If you prefer a live conversation, we can facilitate a call between you and the expert. After the call, you’ll get the full recording, a verbatim transcript, and continued platform access to query the content and more.
68 Circular Road, #02-01 049422, Singapore
Revenue Tower, Scbd, Jakarta 12190, Indonesia
4th Floor, Pinnacle Business Park, Andheri East, Mumbai, 400093
Cinnabar Hills, Embassy Golf Links Business Park, Bengaluru, Karnataka 560071
Request Custom Transcript
Related Transcripts


68 Circular Road, #02-01 049422, Singapore
Revenue Tower, Scbd, No.52-53, Jakarta 12190, Indonesia
Cinnabar Hills, Embassy Golf Links Business Park, Bengaluru, Karnataka 560071
4th Floor, Pinnacle Business Park, Andheri East, Mumbai, 400093


68 Circular Road, #02-01 049422, Singapore
Revenue Tower, Scbd, Jakarta 12190, Indonesia
4th Floor, Pinnacle Business Park, Andheri East, Mumbai, 400093
Cinnabar Hills, Embassy Golf Links Business Park, Bengaluru, Karnataka 560071