

68 Circular Road, #02-01 049422, Singapore
Revenue Tower, Scbd, Jakarta 12190, Indonesia
4th Floor, Pinnacle Business Park, Andheri East, Mumbai, 400093
Cinnabar Hills, Embassy Golf Links Business Park, Bengaluru, Karnataka 560071


Connect With Us


68 Circular Road, #02-01 049422, Singapore
Revenue Tower, Scbd, Jakarta 12190, Indonesia
4th Floor, Pinnacle Business Park, Andheri East, Mumbai, 400093
Cinnabar Hills, Embassy Golf Links Business Park, Bengaluru, Karnataka 560071
Connect With Us
68 Circular Road, #02-01 049422, Singapore
Revenue Tower, Scbd, Jakarta 12190, Indonesia
4th Floor, Pinnacle Business Park, Andheri East, Mumbai, 400093
Cinnabar Hills, Embassy Golf Links Business Park, Bengaluru, Karnataka 560071
Request Custom Transcript
Blockchain-Based Supply Chain Transparency: Cloud Integration & Auditability Solutions
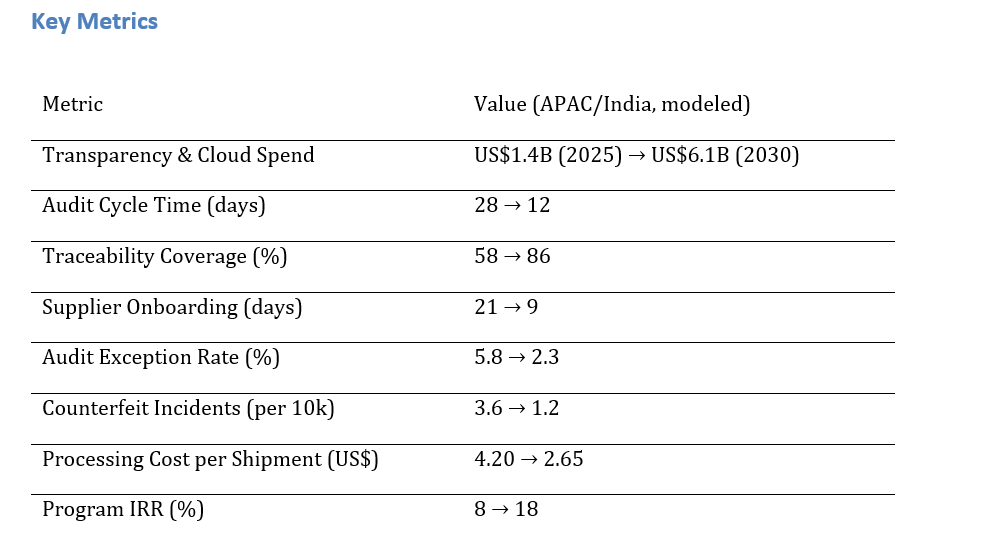
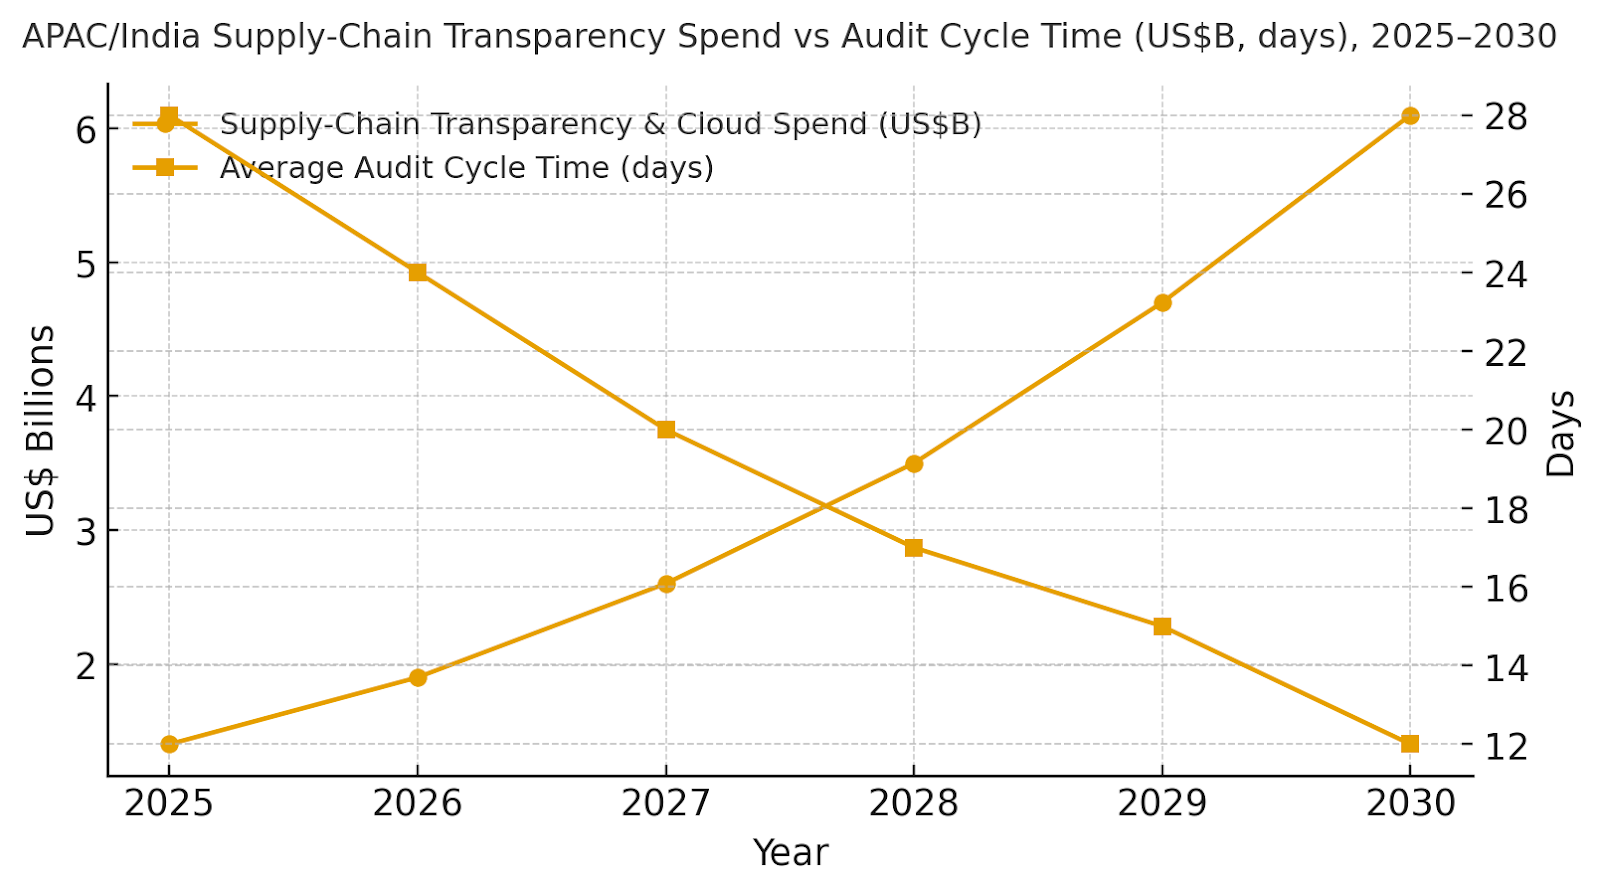
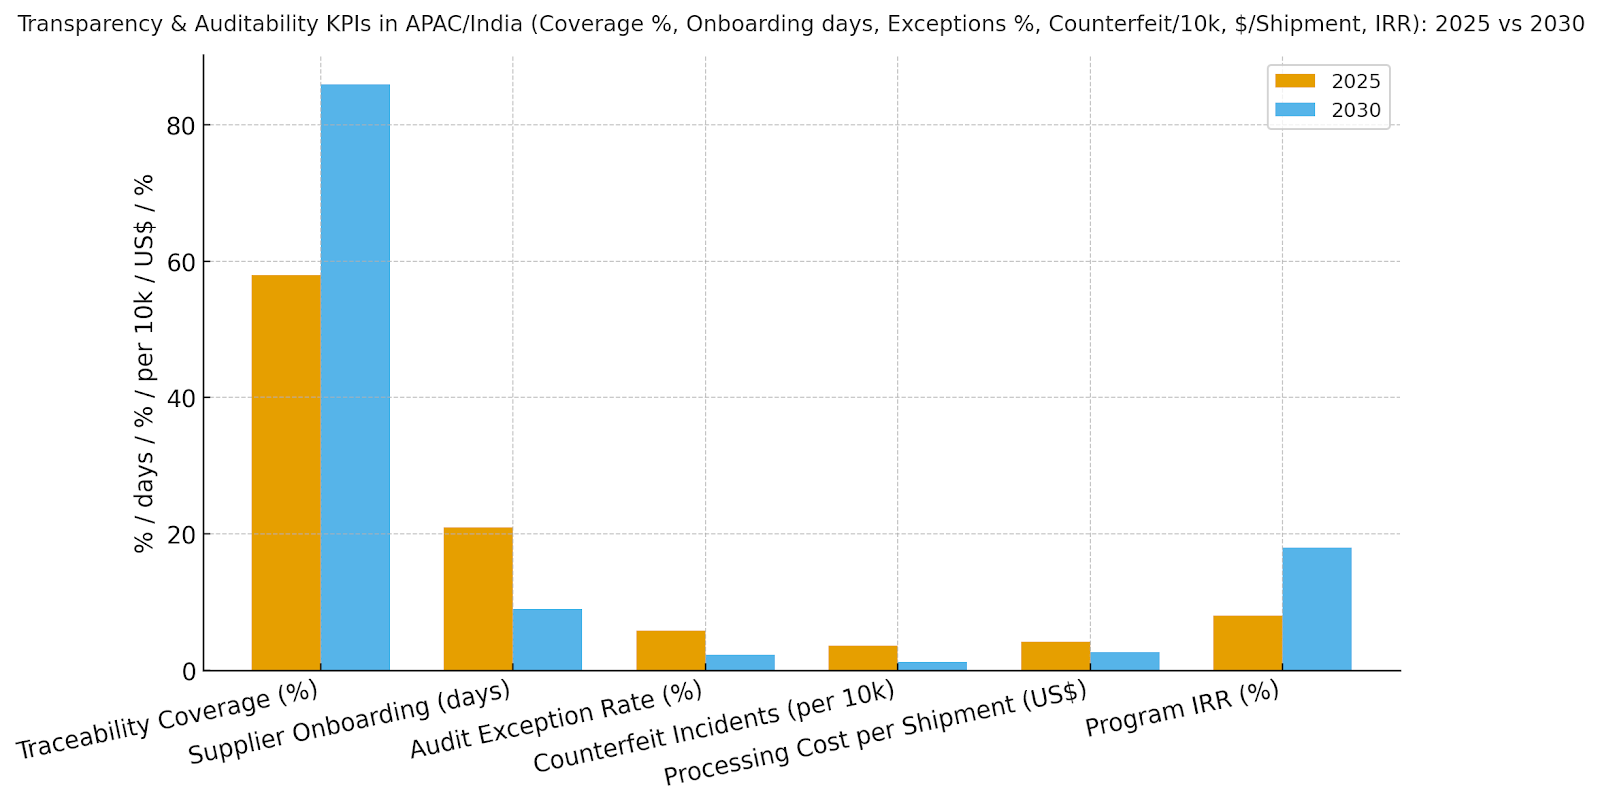
India and the wider Asia-Pacific export corridor are adopting blockchain-based supply chain transparency platforms integrated with cloud and ERP systems. Spend is projected to grow from ~$1.4B in 2025 to ~$6.1B by 2030 as firms pursue end-to-end traceability, compliance automation, and counterfeit reduction. Audit cycles shorten from 28 to 12 days, traceability coverage rises from 58% to 86%, and counterfeit incidents fall from 3.6 to 1.2 per 10,000 shipments. Processing costs drop from $4.20 to $2.65, while supplier onboarding time decreases from 21 to 9 days. Blockchain integration transforms supply chains into continuously auditable, trusted ecosystems across India and APAC.
What's Covered?
Report Summary
Key Takeaways
1. Hybrid ledgers deliver privacy with public verifiability for audits and recalls.
2. Digital Product Passports expand coverage to ~86% of SKUs/lots by 2030.
3. EPCIS + IoT streams compress audit cycle times to ~12 days on average.
4. Counterfeit risk falls with serialisation and custody proofs at hand‑offs.
5. Supplier onboarding shortens via templated data contracts and KYC/AML flows.
6. Processing cost per shipment declines ~37% with straight‑through processing.
7. Regulator & customer portals standardize evidence sharing and trust.
8. C‑suite dashboard: coverage %, onboarding days, exceptions %, counterfeit/10k, $/shipment, IRR.
a) Market Size & Share
APAC/India transparency spend is modeled to grow from ~US$1.4B in 2025 to ~US$6.1B by 2030. The dual‑axis figure shows spend growth versus audit cycle time improving from ~28 to ~12 days as event capture scales and ledgers interoperate with ERPs and logistics systems. Share accrues to vendors delivering standards‑based capture (GS1/EPCIS), identity & product graphs, and exportable audit proofs. Execution risks: inconsistent metadata and partial supplier participation; mitigations: catalog remediation, incentives, and hybrid designs. Share should be tracked via coverage %, onboarding days, exception %, counterfeit/10k, $/shipment, and IRR—not bookings alone.
b) Market Analysis
Our model shows traceability coverage rising ~28 points to ~86% as DPP and serialization expand; onboarding time halves to ~9 days with templated contracts; audit exception rate falls from ~5.8% to ~2.3%; counterfeit incidents reduce to ~1.2 per 10k shipments; and processing cost per shipment drops ~37%. IRR improves from ~8% to ~18% by 2030. Enablers: EPCIS event streams, IoT telemetry for cold‑chain, and serverless rules engines. Barriers: variable digital maturity, cross‑border data rules, and change management. Financial lens: combine avoided disputes/chargebacks with faster customs clearance and reduced inspection costs. The bar chart summarizes KPI movement under disciplined programs.
c) Trends & Insights
1) Digital Product Passports unify serials/batches with sustainability attributes. 2) Hybrid ledgers: permissioned settlement cores with public proof anchoring. 3) Privacy‑preserving audit proofs (hashes/zk‑style summaries) reduce disclosure risk. 4) IoT‑first cold‑chain with exception alerts for pharma/food. 5) Supplier scoring ties payment terms to data quality and on‑time event capture. 6) Trade finance embeds shipment events to unlock working capital. 7) Recall automation spans regulators, customers, and carriers. 8) Green logistics metrics (fuel/temperature excursions) enter dashboards. 9) Open APIs/exportable policies prevent lock‑in. 10) Outcome‑based pricing aligns fees to exception reduction and clearance speed.
d) Segment Analysis
Pharma/Cold Chain: serialization, DSCSA‑style trace, and temperature integrity. Food & Agriculture: farm‑to‑fork trace, contamination containment, and freshness claims. Electronics/Conflict Minerals: provenance from smelter to device and EPR reporting. Automotive/Industrial: parts genealogy and recall readiness. Apparel: ESG/material origin and factory compliance. Trade Finance/Customs: event‑driven documents and KYC/AML. Across segments, track coverage %, onboarding days, exception %, counterfeit/10k, $/shipment, and IRR; tune policy sets per lane and regulatory requirement.
e) Geography Analysis
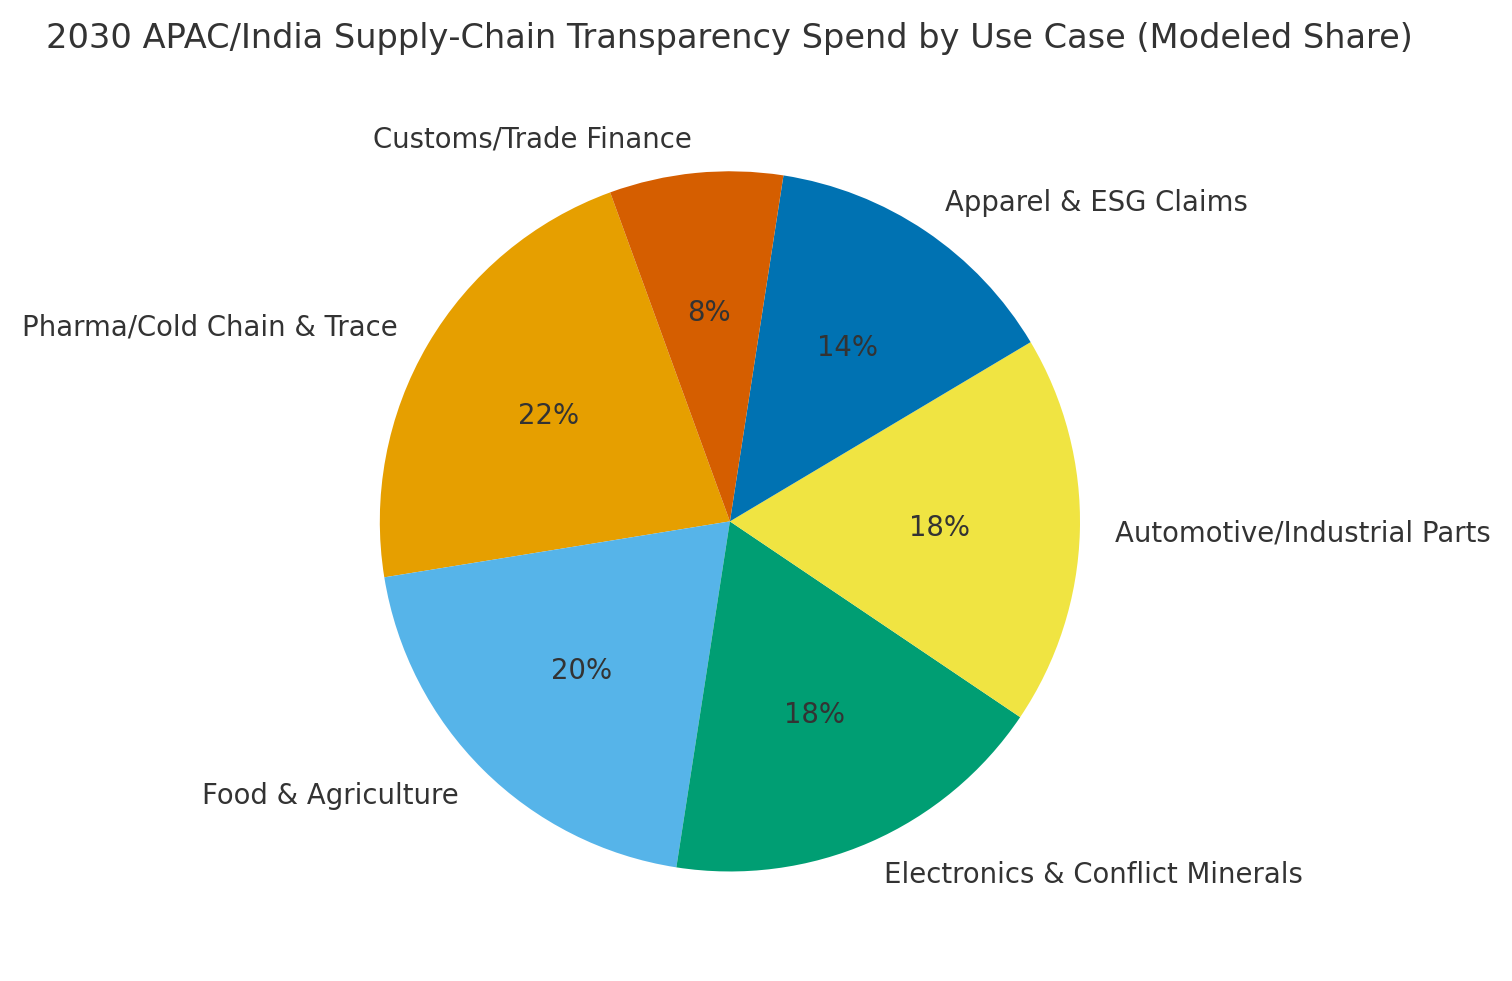
By 2030, we model APAC/India spend/use‑case mix as Pharma (~22%), Food & Agriculture (~20%), Electronics & Conflict Minerals (~18%), Automotive/Industrial (~18%), Apparel & ESG (~14%), and Customs/Trade Finance (~8%). The pie figure reflects the mix. Adoption concentrates in pharma hubs and export corridors (Delhi NCR, Mumbai, Bengaluru, Chennai) with expansion into electronics and apparel as DPP standards mature. Execution: invest in supplier enablement, align cross‑border data flows to DPDP/standard contractual clauses, and publish audit dashboards to customers and regulators.
f) Competitive Landscape
Competition spans cloud providers, blockchain platforms, supply‑chain suites, and IoT integrators. Differentiation vectors: (1) standards compliance (GS1/EPCIS/DPP), (2) hybrid ledger designs with exportable proofs, (3) onboarding tooling and incentives for tier‑2/3 suppliers, (4) regulator/customer portals, and (5) time‑to‑value via templates for pharma/food/electronics. Procurement guidance: require open APIs, proof exports, SLAs for onboarding and exception triage, and cost/throughput benchmarks. Competitive KPIs: coverage %, onboarding days, exception %, counterfeit/10k, $/shipment, and IRR uplift.
Report Details
Proceed To Buy
Want a More Customized Experience?
- Request a Customized Transcript: Submit your own questions or specify changes. We’ll conduct a new call with the industry expert, covering both the original and your additional questions. You’ll receive an updated report for a small fee over the standard price.
- Request a Direct Call with the Expert: If you prefer a live conversation, we can facilitate a call between you and the expert. After the call, you’ll get the full recording, a verbatim transcript, and continued platform access to query the content and more.
68 Circular Road, #02-01 049422, Singapore
Revenue Tower, Scbd, Jakarta 12190, Indonesia
4th Floor, Pinnacle Business Park, Andheri East, Mumbai, 400093
Cinnabar Hills, Embassy Golf Links Business Park, Bengaluru, Karnataka 560071
Request Custom Transcript
Related Transcripts


68 Circular Road, #02-01 049422, Singapore
Revenue Tower, Scbd, No.52-53, Jakarta 12190, Indonesia
Cinnabar Hills, Embassy Golf Links Business Park, Bengaluru, Karnataka 560071
4th Floor, Pinnacle Business Park, Andheri East, Mumbai, 400093


68 Circular Road, #02-01 049422, Singapore
Revenue Tower, Scbd, Jakarta 12190, Indonesia
4th Floor, Pinnacle Business Park, Andheri East, Mumbai, 400093
Cinnabar Hills, Embassy Golf Links Business Park, Bengaluru, Karnataka 560071